
Integrated Graphical User Interface
Fully integrated interface combining easy to use graphical tools, seamless model run, and automated contouring and posting of results.
Overview
SLAB View is a graphical user interface for the SLAB model - an atmospheric dispersion model for denser-than-air releases. SLAB View is an ideal tool to predict hazardous zones and potential impacts of accidental releases.
SLAB View is able to show you how the release develops over time, as well as what the total footprint of the release will be.
SLAB View can model continuous, finite duration, and instantaneous releases from four types of sources:
The SLAB model was developed in the 1980s by Lawrence Livermore National Laboratory (LLNL), with financial support from the Department of Energy (DOE). The SLAB model is currently distributed and supported by the US EPA.
Features
Fully integrated interface combining easy to use graphical tools, seamless model run, and automated contouring and posting of results.
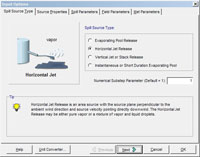
SLAB View models several different release types:
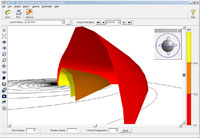
Watch the plume disperse in three dimensions using the 3D View option. Understanding how a release spreads has never been easier.SLAB 3D allows you to create animations of plume migration that can be incorporated into most presentation packages.
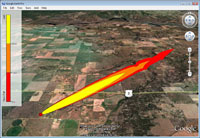
This exciting feature allows you to export the footprint and or puff of the source spill into Google Earth giving you a more realistic image of where the spill will impact surrounding areas.
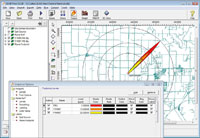
SLAB View provides you with full control of the appearance of your footprints and puffs. You can specify the footprint levels (ppm) to be displayed, which colors to use, line thickness, and much more.
SLAB View has an extensive database of chemicals that can be modeled, including their properties. User defined chemicals can also be added.
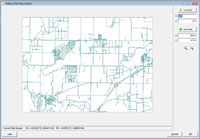
SLAB View has support for a variety of image and base map formats allowing you to setup your model with confidence and easy visualization and identification of the location of your spill area. Supported base maps include: Bitmap, DLG, DXF, JPEG, LULC, MrSID, Shapefile, and TIFF/GeoTIFF.
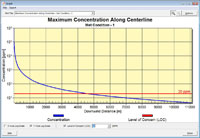
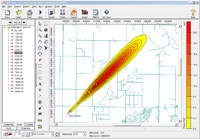
SLAB View automatically generates graphs displaying the Maximum Concentration Along the Centerline for all the meteorological conditions being modeled. You can specify the Level of Concern (LOC) for the chemical being modeled to be shown in the graph (indicated in this image as a red line).
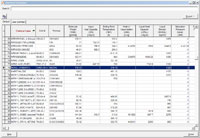
SLAB View produces several easy ways for you to understand the SLAB output results. You can view the footprint, the puff over time, graphs of maximum concentration alog centerline, and a text report sumarizing the input and output data.
Technical Specifications
SLAB View is an interface for the SLAB model. See below the technical specifications for this model:
| Parameter | Description | |
|---|---|---|
| Model Name | SLAB - An Atmospheric Dispersion Model for Denser-Than-Air Releases | |
| Developed By | Dr. Donald L. Ermak, Lawrence Livermore National Laboratory (LLNL) | |
| Model Type | Steady-state Gaussian Plume model | |
| Time Step | Seconds | |
| Range | Near Field | |
| Terrain | Not modeled | |
| Building Downwash | Not modeled | |
| Source Types | Evaporating pool, horizontal jet, vertical jet or stack, instantaneous or short duration evaporating pool | |
| Input Meteorology | User defined meteorological conditions | |
| Wind Field | Homogeneous | |
| Release Types | Denser than air plumes | |
| Emission Types | Emergency release, continuous and transient emissions | |
| Atmospheric Chemistry | Not modeled | |
| Output | SLAB produces outputs of chemical concentrations at various positions downwind and at specified heights above the ground | |
| Regulatory Status | US EPA Alternative Model | |
System Requirments
This product is a Microsoft Windows-based program that can be installed in the following Windows operating systems:
Minimum requirements: