+91 40 23549924/8905

info@lagasys.com

MapViewer

Make the most of your spatial data.

Overview

Example blog post alt

Visualize Data

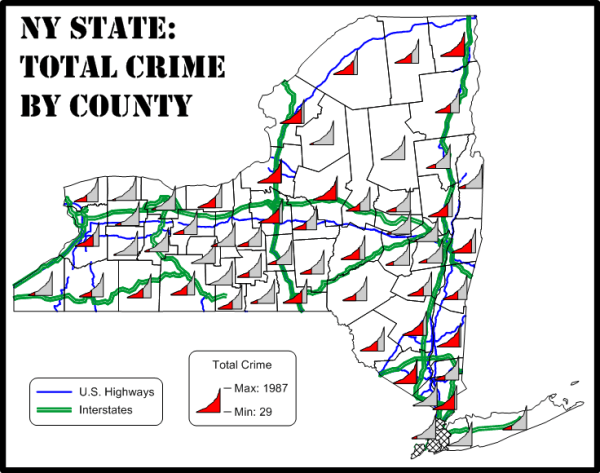
Make the most out of your data. Quickly produce publication-quality maps with MapViewer’s extensive thematic mapping and spatial analysis features. Distinguish patterns and trends in your data, understand the spatial relationship, and give clients and stakeholders the information they need.


Analyze Data

Put data to work for you. MapViewer gives you tools to visualize and analyze the geographic distribution of your data so you can make decisions with confidence. Locate opportunities to drive efficiency, innovation, and profitability. MapViewer turns your data into valuable information.

Example blog post alt

Example blog post alt

Communicate Results

Transformed data into actionable results. MapViewer’s numerous map types and customization options allow you to easily communicate results with clients, stakeholders, and coworkers.


Trusted Solution

Hundreds of people across the globe use MapViewer to present their spatial data. See for yourself why so many people trust MapViewer to visualize their data.

Example blog post alt

We Are Here to Help

Expert advice and learning is a click away. We're here to help you through every stage of your project.


Features

Example blog post alt

Create Professional Thematic Maps

Take control of your spatial data. MapViewer’s powerful mapping abilities transform spatial data into informative thematic maps. The flexible map display, instant customizations, and advanced analytics make MapViewer a go-to tool for GIS analysts, business professionals, and anyone dealing with spatially-distributed data.

MapViewer Map Types
  • Base, Symbol, Line Graph, Prism
  • Pin, Density, Gradient, Pie
  • Choropleth, Territory, Bar, Cartogram
  • Contour, Vector, Flow, Multi-graph

Enhance Maps

Create maps that are as beautiful as they are intelligent. MapViewer’s extensive customization options let you create maps to clearly communicate your message.

MapViewer Customization Options
  • Add titles, legends, scale bars, graticules, map collars, and insets
  • Apply linear color scales
  • Edit all axis parameters
  • Define custom line styles and colors
  • Add text, polylines, polygons, symbols, and spline polylines
  • Edit text, line, fill and symbol properties
  • Include multiple maps in a display
  • Adjust tilt and rotation
Example blog post alt

Example blog post alt

Make Informed Decisions

Utilize MapViewer’s geoprocessing tools to make better, more informed decisions about your spatial data. Highlight areas of interest, narrow down sections to perform further analysis, and apply mathematical calculations on the raw data to discover new insights.

MapViewer Boundary Editing Tools
  • Reshape, clip, smooth polylines, and polygons
  • Create buffers around points, polylines, and polygons
  • Convert between polygons and polylines
  • Create new polygons by combining existing polygons that overlap or share a border
  • Create points or polygons at areas of intersection for overlapping areas
  • Connect or break polylines at specified locations
  • Combine and split islands
MapViewer Analysis Tools
  • Query map data and attributes
  • Generate various map and object data reports
  • Evaluate spatial relationships and distances
  • Perform geocoding

Work Seamlessly with all Coordinate Systems

MapViewer makes it easy to transform spatial data into informative maps. MapViewer effortlessly manages unreferenced data and data projected in different or multiple coordinate systems.

MapViewer Coordinate System Features
  • Over 2500 predefined coordinate systems
  • Create custom coordinate systems
  • Search coordinate systems by name or EPSG number
  • Reproject coordinate systems
  • Over 80 ellipsoids
  • Over 45 predefined linear units
  • Create custom linear units
  • Use pre-defined or custom datums
Example blog post alt

Example blog post alt

Immediate Access to Online Data

An abundance of data is at your fingertips waiting to be visualized. MapViewer gives you immediate access to maps downloaded from any online web mapping services (WMS), public or private.


Work Smart, Not Hard with Automation

Don’t waste time doing the same process over and over. Create scripts to automate repetitive tasks, and run your favorite scripts directly from the Grapher ribbon. Grapher can be called from any automation-compatible programming languages such as C++, Python, or Perl. Grapher also ships with Scripter, a built-in Visual Basic compatible scripting tool. Better yet, use the script recorder to transform actions performed in Grapher into a script.

Example blog post alt

Example blog post alt

Complete Compatibility

Seamlessly visualize and analyze data from multiple sources. MapViewer natively reads numerous file formats including SHP, DXF, and XLSX. MapViewer also supports many popular export formats.