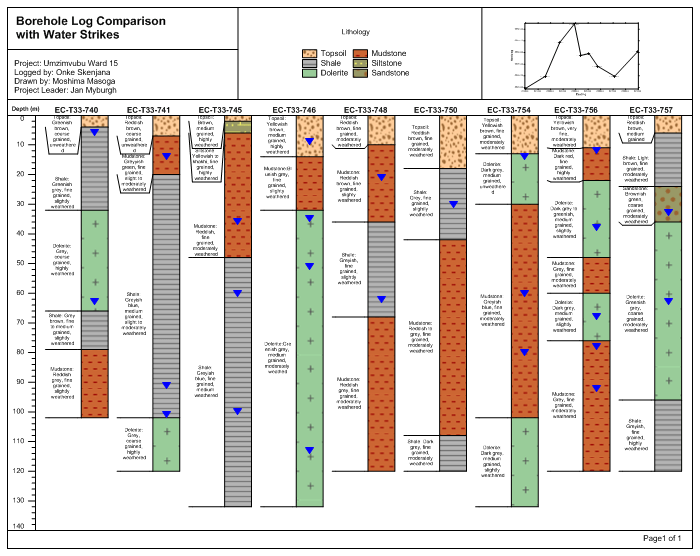
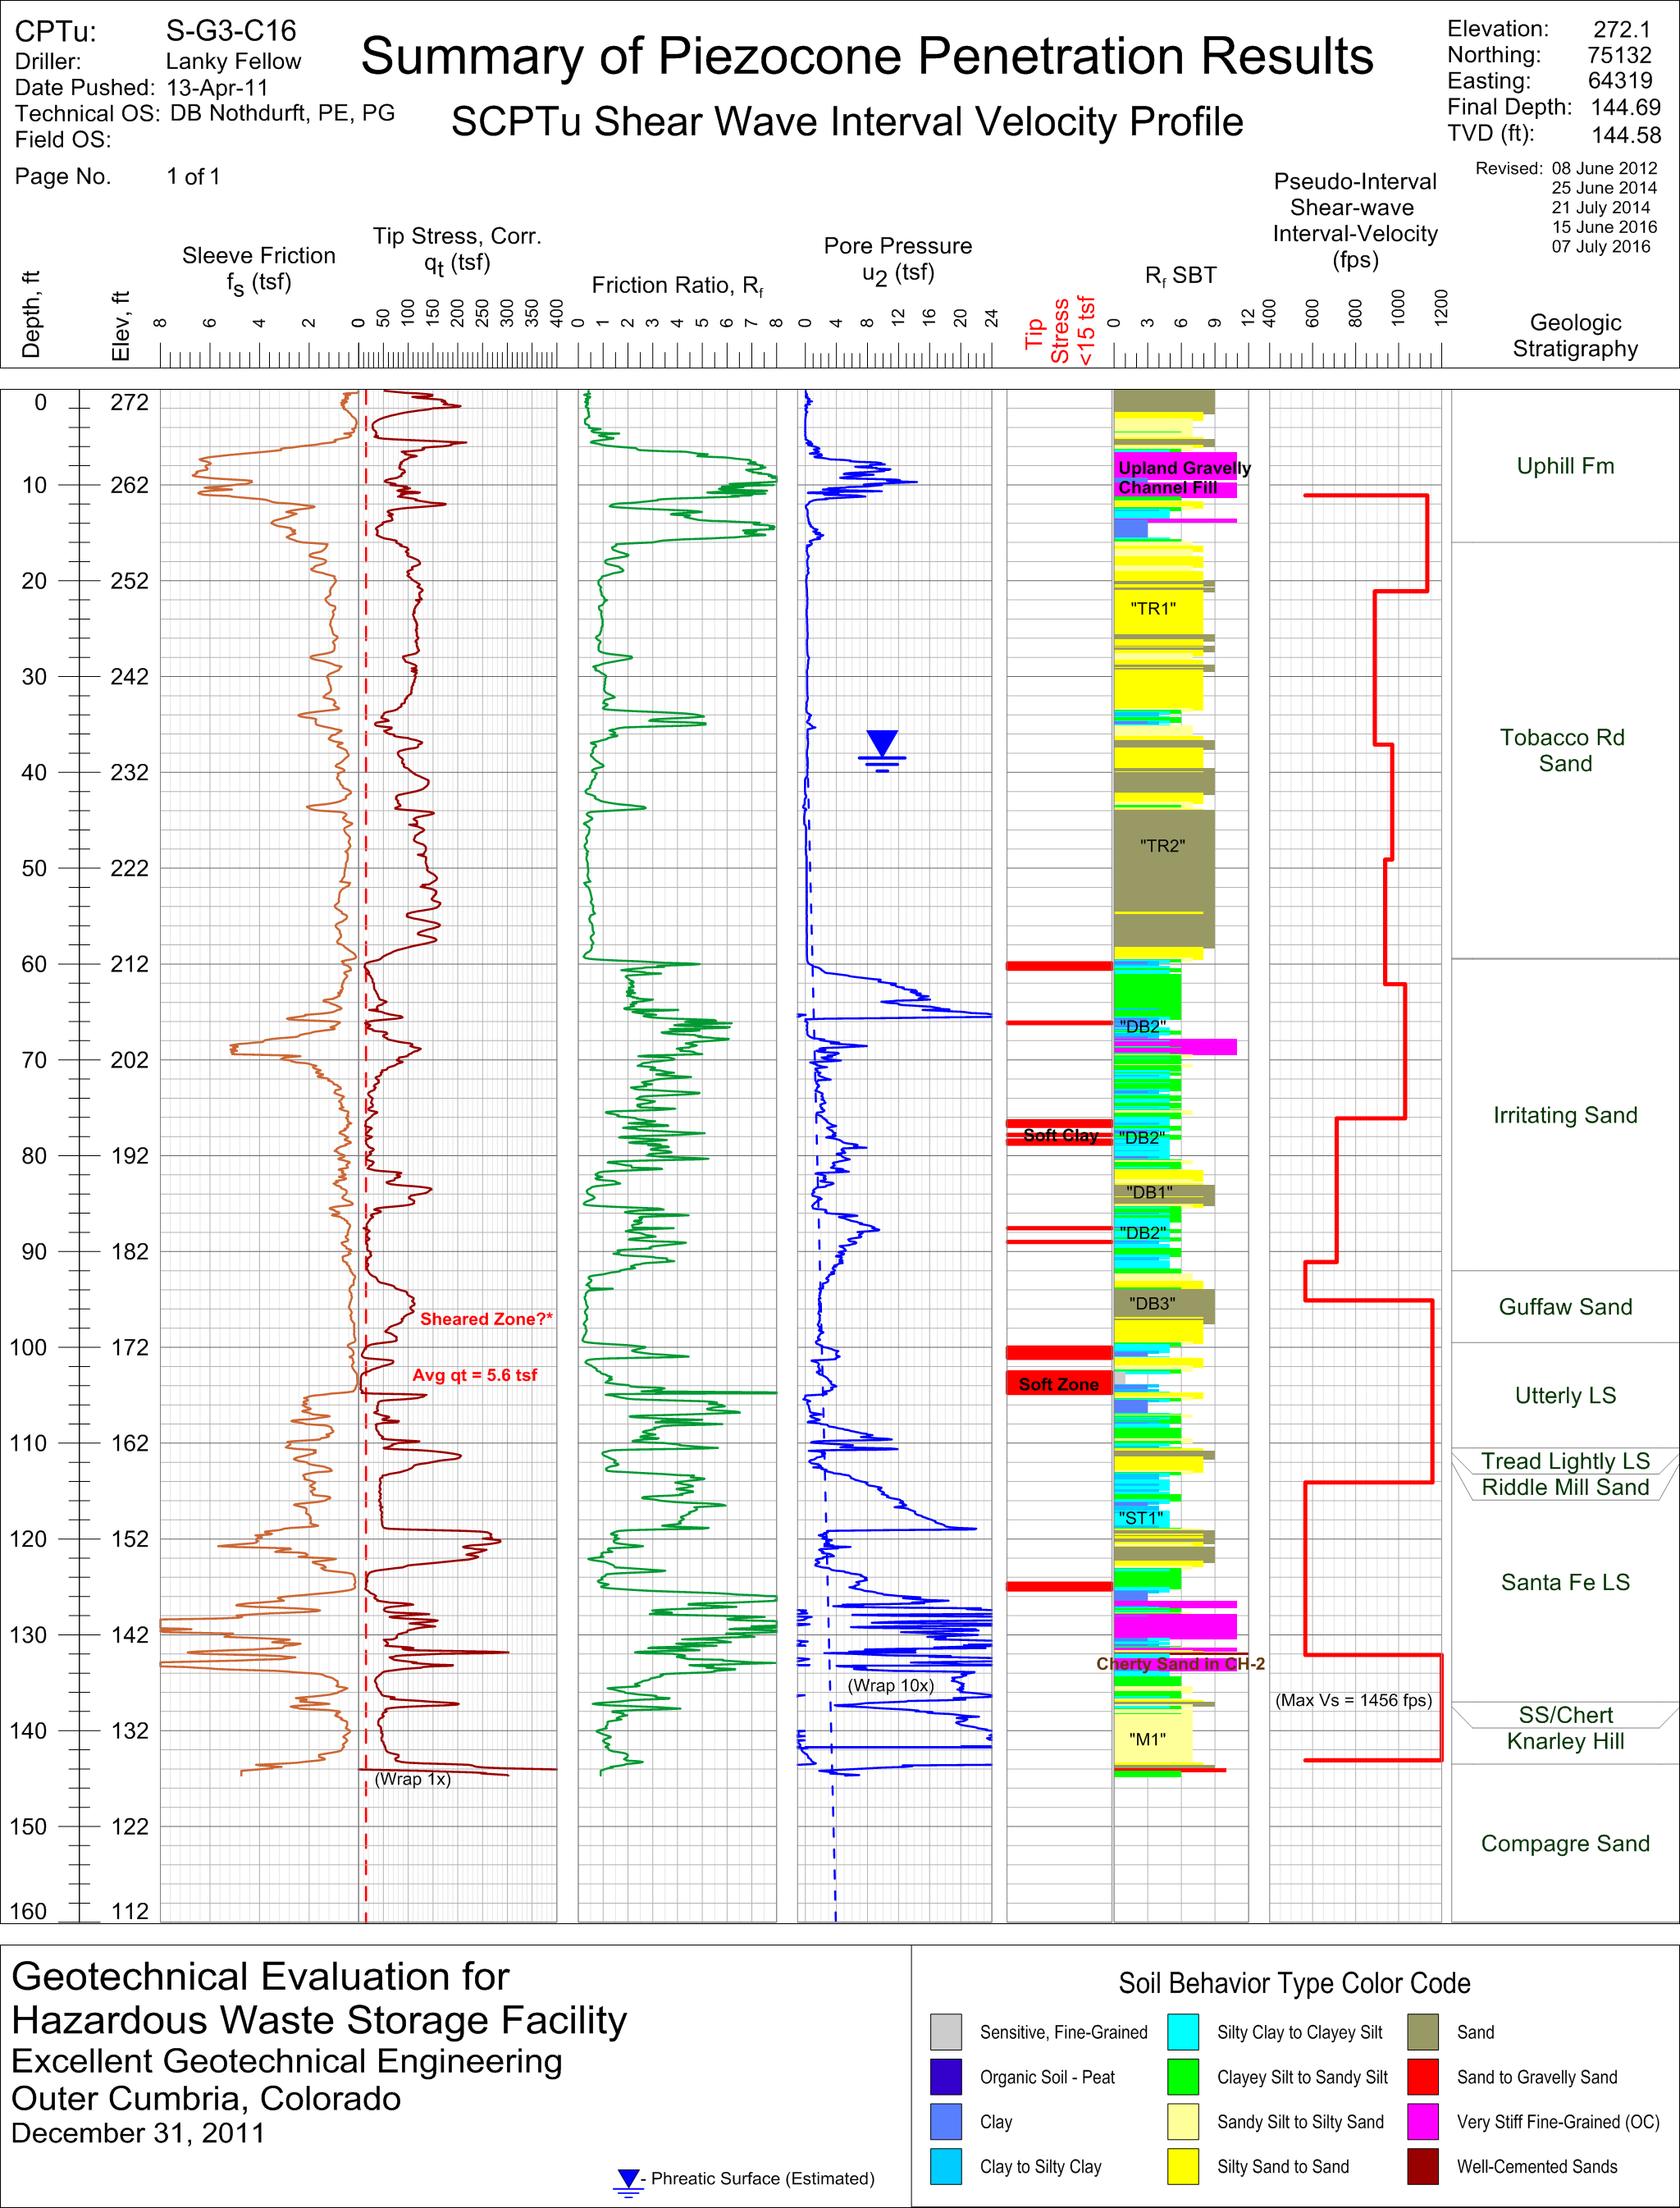
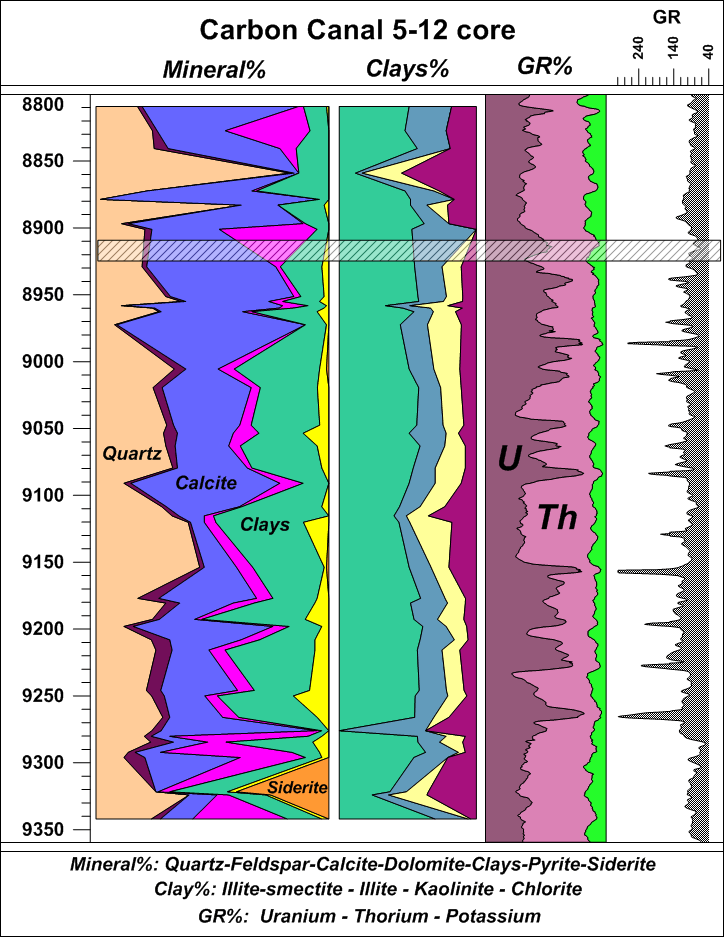
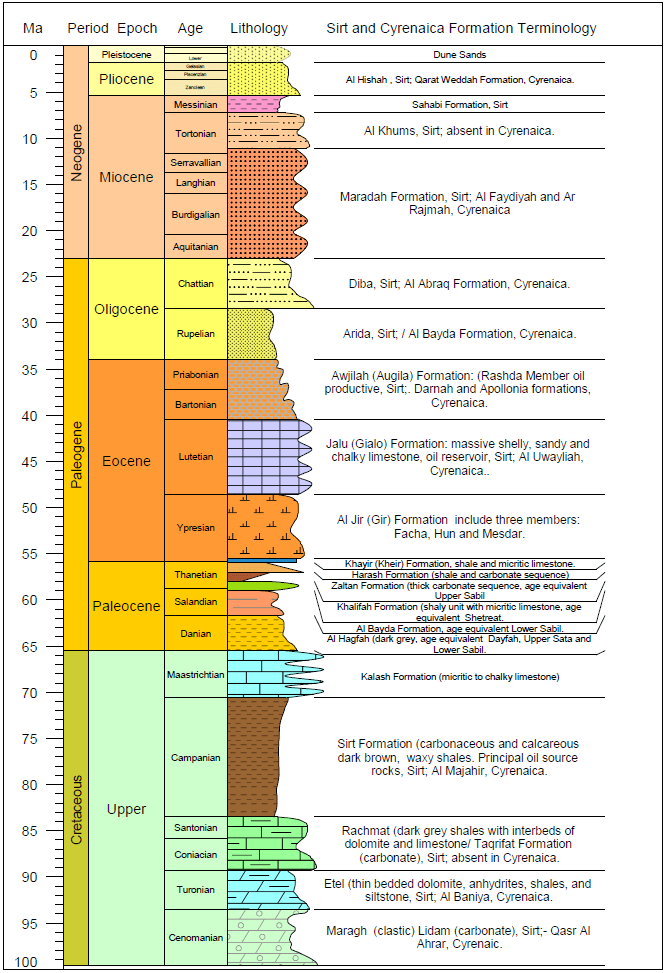
+91 40 23549924/8905

info@lagasys.com

Strater

Eliminate subsurface uncertainty.

Overview

Example blog post alt

Visualize Data

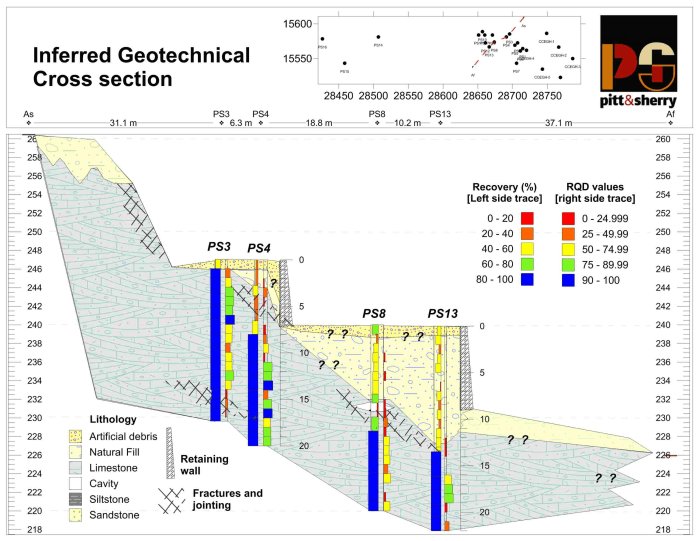
Eliminate subsurface uncertainty. Achieve insight and clarity by transforming raw, subsurface data into understandable well logs, borehole models, and cross sections/profiles. Easily create professional geotechnical reports that clearly communicate important information with Strater.


Analyze Data

Get answers to all your subsurface questions. When displayed in Strater, subterranean data becomes clear and easy to understand. Strater’s extensive features allow you to quickly view and analyze areas otherwise unseen and make decisions with confidence.

Example blog post alt

Example blog post alt

Communicate Results

Transform data into profit. Easily communicate important information to clients, stakeholders, and coworkers. Regardless of data complexity, Strater’s visualization abilities facilitate a complete and thorough understanding of subsurface data.


Trusted Solution

Strater trusted by many scientists and engineers across the globe. Experience Strater for yourself and see why so many others trust Strater to display their data.

Strater is actively used in the following industries:

  • Education, Geotechnical, Mudlogging
  • Energy, Geothermal, Oil & gas
  • Environmental, Government, Utilities
  • Exploration, Military, Water Resources
  • Geophysical, Mining, And More
Example blog post alt

We Are Here to Help

Expert advice and learning is a click away. We're here to help you through every stage of your project.


Features

Example blog post alt

Create Professional Well Logs and Borehole Models

Discover the depths of your data. Strater transforms subsurface data into understandable well logs and borehole models. Achieve a better understanding of your data so you can make informed decisions, every time.

Strater Log Types
  • Depth, Lithology, Post, Well Construction
  • Line/Symbol, Zone Bar, Classed Post, Raster
  • Crossplot, Bar, Graphic, Complex Text, Tadpole

Subsurface Data Made Clear

Evaluate and display all aspects of geological data. Easily create cross sections from lithology/zone bar logs, line/symbol logs, or raster logs to better understand the details of your depth data. Maximize your understanding so you can make the best decisions, every time.

Example blog post alt

Example blog post alt

Enhance Your Geological Model

Represent your data at its best. Precisely display subsurface data with Strater’s numerous customization options. Virtually every aspect of Strater’s logs, models, and cross sections are customizable.

Strater Customization Options
  • Include titles, axes, scale bars, and legends
  • Apply pre-defined or custom fill patterns based on industry standards
  • Generate custom fill libraries to be shared with colleagues and reused across multiple projects
  • Include customized headers and footers
  • Draw text, polylines, polygons, symbols, and spline polylines
  • Utilize tools to align, overlay, or distribute logs as needed
  • Create standardized templates to create consistent reports
Strater Cross Section Customization Options
  • Add any type of log to an existing cross section
  • Display logs as deviated or vertical
  • Display water level(s) in the cross section
  • Add well headers to display borehole information, as well as distance between well tops or bottoms
  • Define and customize lithology/stratigraphy layers
  • Use schemes to quickly apply symbol, fill, and line properties and save them for use across multiple projects
  • Transform cross sections into 3D fence diagrams with the Voxler integration commands
  • Hang logs at the proper elevation

Top-Down View

Create top-down maps to view well log and borehole information in the correct geographic context.

Strater Map View Features
  • Insert map view into both borehole views and cross section views
  • Post well locations, add boundary information, and include image base maps
  • Show borehole deviation paths
  • Easily combine maps from various coordinate systems
  • Use schemes to quickly apply symbol, fill, and line properties and save them for use across multiple projects
  • Add labels from well data
  • Draw text, polylines, polygons, symbols, and spline polylines to create features and annotations
  • Include and edit axis ticks, labels, and grid lines
Example blog post alt

Example blog post alt

Streamlined Workflows

Increase productivity. Quickly create informative and useful models with Strater’s intuitive user interface. Thereafter, easily view all project information with the dynamic graphical display where you can see boreholes, maps, and cross sections in a single project.

Strater User Interface Features
  • Single window to view, edit, and manipulate logs and models
  • Object manager to easily manage logs, cross section components, and map layers
  • Property manager for quick feature editing
  • View manager to customize the display of boreholes, maps, and cross sections
  • Table manager to view or edit raw data
  • Dock or float and hide or display all managers
  • Welcome dialog to get you started
  • Customize practically all aspects of the user interface to fit your needs

Collaborate with Confidence

Confidently share your well logs and borehole models with stakeholders, clients, and colleagues. Strater maps and models are ready for printed publication with high quality formats like PDF or TIFF. Alternatively, insert diagrams into presentation tools such as Microsoft Word or PowerPoint with a simple copy and paste.


Example blog post alt

Complete Compatibility

Seamlessly visualize and analyze data from multiple sources. Strater natively reads numerous file formats including LAS, XLSX, and ASCII text files. Strater also supports many popular export formats. An extensive set of data management tools are at your disposal.