


AQMIS is a cloud solution that includes all the features and capabilities required to manage environmental programs. The main features include:
| Dashboards | Air Quality Index (AQI) |
| Emissions Inventory | Human Health Risk Assessment |
| Ambient Air Monitoring | GIS/Mapping |
| Air Dispersion Modeling | Permitting and Compliance |
| Water Quality | Calendar and Ticketing |
| Solid Waste | Reporting |
| Neural Net Air Quality Forecasting | Systems Administration |
Dashboards
AQMIS provides customizable screens that visually present critical air quality data for facilities, government and the public.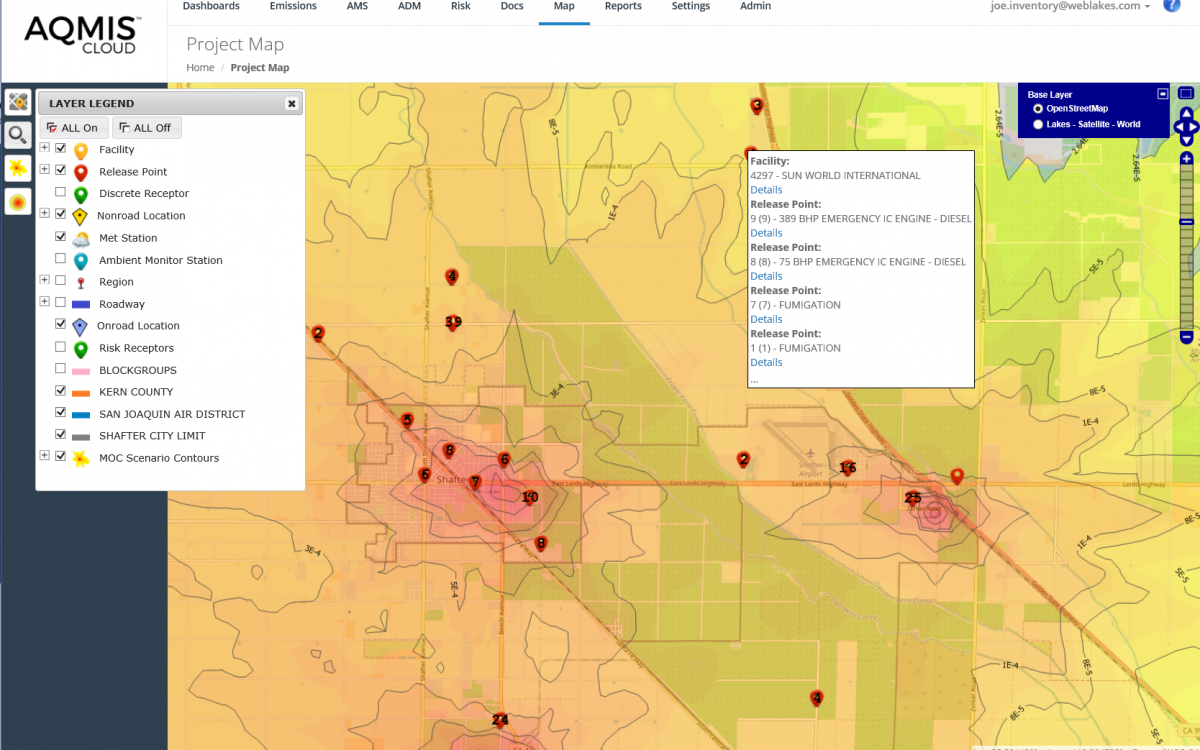
Emissions Inventory
AQMIS provides an extensive database to manage air emissions data and calculations for thousands of sources and pollutants.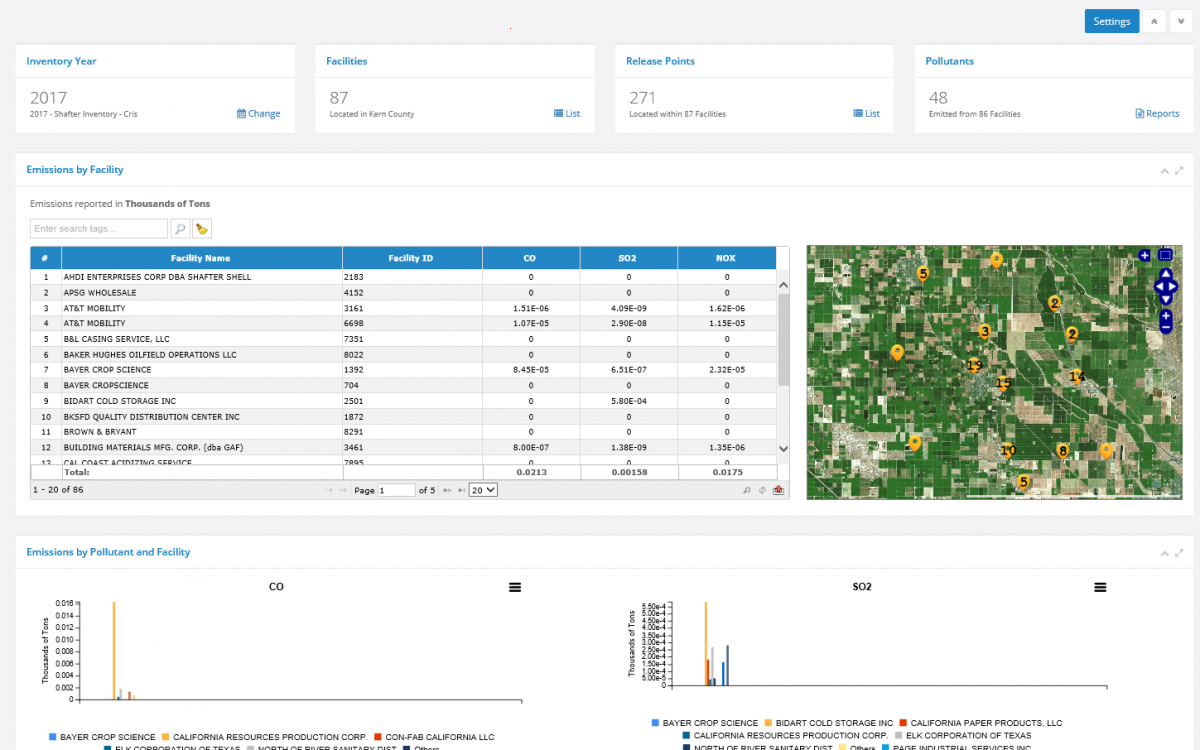
Ambient Monitoring
AQMIS provides an extensive database to manage air emissions data and calculations for thousands of sources and pollutants.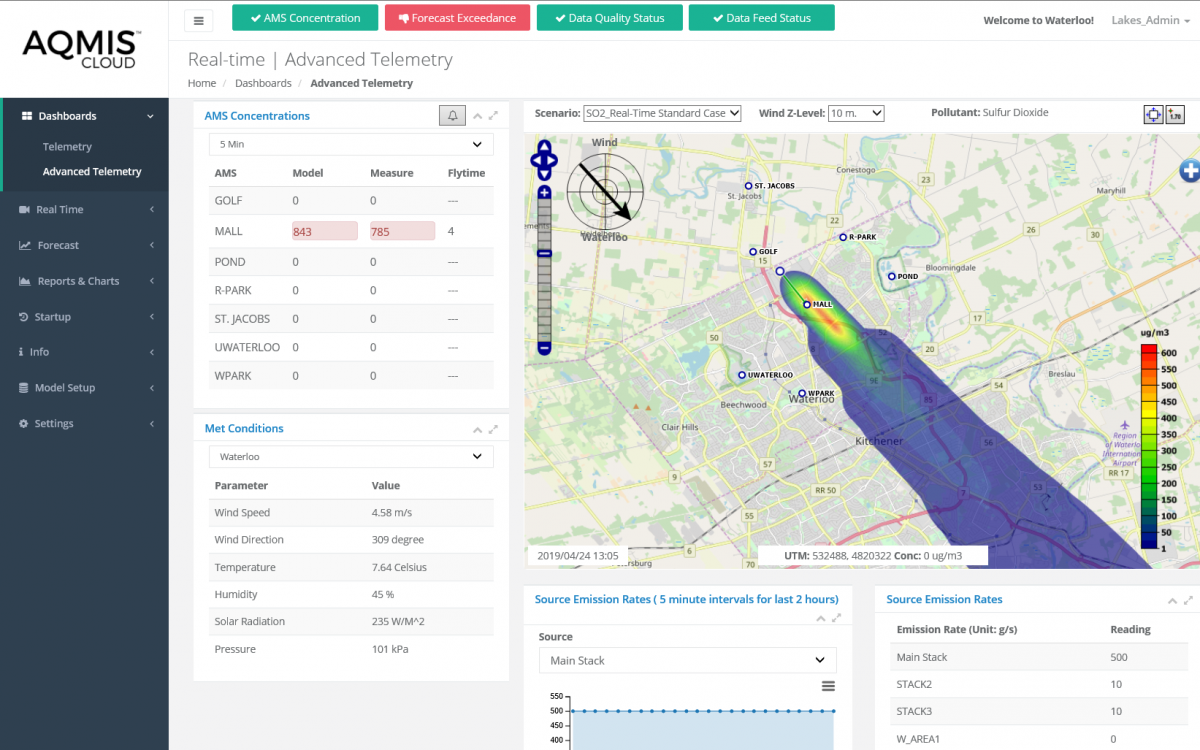
Air Dispersion Modelling
Extensive air dispersion modeling scenarios can be processed entirely within AQMIS for popular and regulatory air dispersion models.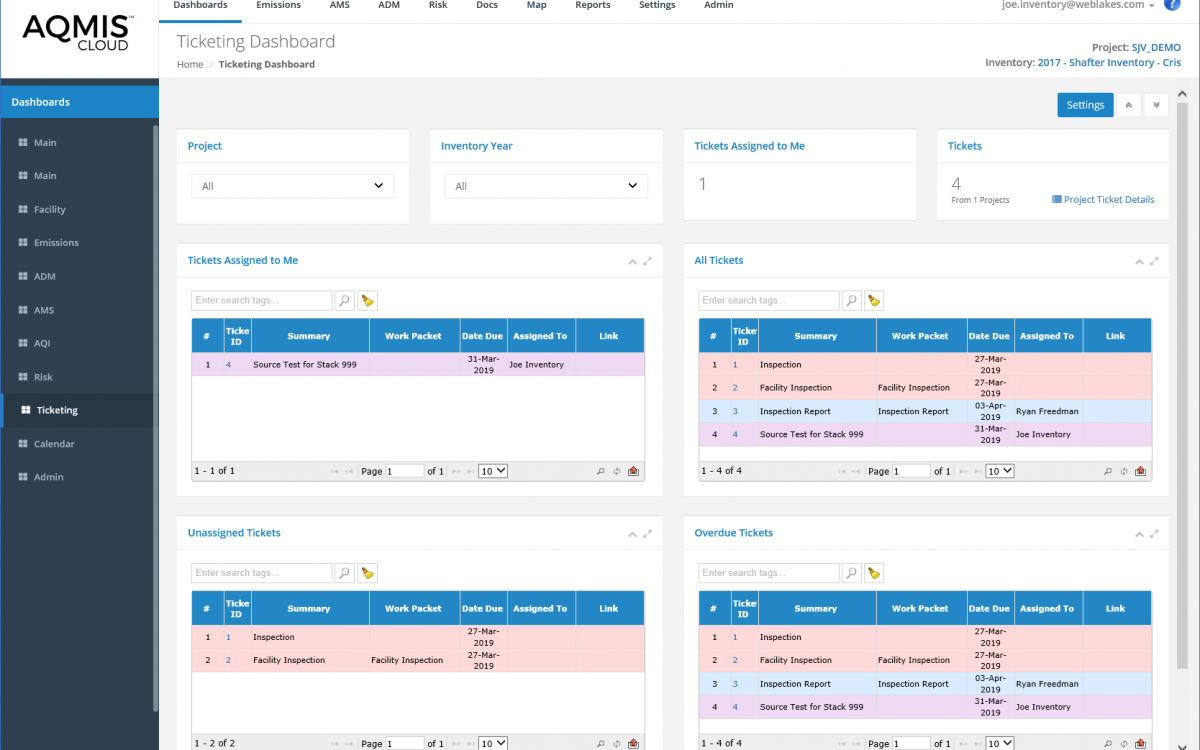
Water Quality
Includes all the capabilities necessary for you to implement water quality monitoring and reporting for water and wastewater programs.
GIS/ Mapping
Powerful GIS and mapping tools are built into AQMIS to view emissions and air quality data, removing the need for third-party GIS tools.Benefits
- Increase Productivity
- Eliminate the Need for Paper Forms
- Integrate Legacy System and Spreadsheets into a Single Application
- Standardize Agency Workflows and Procedures
- Reduce Costs and Eliminate Red Tape
- Consolidate your Data

Features
- Web-Based Solution, Cloud or Locally Hosted
- User Customizable and Fillable PDF Forms
- Dashboards and KPIs
- Fully Integrated GIS
- Library Including IPCC, AP-42, and EIIP Estimation Methods
- Online and Mobile Data Capture
- Calendar and Ticket Tracking
- Air Quality Index (AQI)

Capabilities
- Emissions Inventory
- Regulatory Air Dispersion Modeling
- Forecast Air Quality
- Emergency Release Modeling
- Ambient Air Monitoring
- Permitting and Compliance
- Human Health Risk Assessment
- Electronic Submission
- AB 617
Integrated Solution
- Emissions Inventory
- Air Dispersion Modeling
- Air Quality Forecasting
- Ambient Air Monitoring
- Human Health Risk Assessment
- Wastewater and Solid Waste
- Permitting and Compliance
- GIS/Mapping
- Dashboards and Reports
- GHG

Modules
The AQMIS Emissions Inventory module provides you with an extensive database to manage emissions from a process level, to a facility level, and even to an airshed level. Numerous screens and utilities provide different perspectives and options from which to manage your data. The module’s collection of user tools allows you to seamlessly import and export facility data for a range of source types including stacks, nonroad and onroad sources, tanks, and other specialty sources. Emissions calculation tools including U.S. EPA AP-42 allow you to generate emission values for individual sources or in batch calculations. AQMIS supports the inclusion of unlimited pollutants and emission sources as well as the ability for users to easily create custom emissions calculators.
The AQMIS Ambient Air Monitoring module lets users easily import, export, and organize their ambient air monitoring data. Data may be imported directly through templates, or through continuous processes in near-real-time. A collection of customizable charts, graphs and tables illustrate trends in the monitoring data, identify exceedances, flag issues in data quality (such as missing or out-of-range data), and provide other valuable information. Observed monitor data may be compared with air dispersion model results to support validating both model results, and instrument performance and siting.
The AQMIS Air Dispersion Modeling Module allows you to conduct air dispersion modeling using your source and emissions data. AQMIS supports a collection of popular and regulatory air dispersion models including AERMOD, CALPUFF, SCICHEM, WRF-CHEM, CMAQ, and CAMx. Model runs are executed within the AQMIS solution and do not require external connection to additional modeling software. Using high performance computing processes, models that include hundreds of sources can be run in minutes instead of days, allowing easy comparisons between scenarios and evaluation of impacts over wide areas. Historical meteorological data in WRF or MM5 format are immediately available for model runs over specific time periods. AQMIS allows users to configure all required model inputs such as release points, buildings, sensitive receptors, and receptor grids. Most inputs may be entered manually or uploaded from spreadsheets or specified file formats using step-by-step guided wizards. Results may be compared to air quality standards, presented in reports, and displayed visually on the map.
The AQMIS Water Quality module includes all the capabilities necessary for you to implement water quality monitoring and reporting including water and wastewater programs. The module allows water managers to acquire, process, model, and publish water quality data including drinking water, stormwater, wastewater, and groundwater. A simple interface design delivers the latest science-based data analytics techniques in an intuitive and easy to use interface. The AQMIS water module allows you to maintain real-time data access, provides a centralized water quality data center, supports building customized calculators, and presents myriad tracking functions. Data is easily exported to popular document formats and can be presented in reports generated using simple or complex data queries.
The AQMIS Solid Waste module streamlines the waste management process to allow you to ensure compliance with hazardous waste regulations that govern end-to-end waste generation, handling, transportation, storage, and disposal. The solution’s robust features and capabilities enable companies and regulators to manage and reduce waste, ensure regulatory compliance, and improve their environmental performance. The AQMIS waste profiling capabilities serve as the central online location for managing and monitoring waste profiles. Regulated entities can securely fill out and submit profiles online, saving time, money, and administrative headaches. Track your waste processes from start to finish and quickly identify bottlenecks in the process to improve system efficiencies. Dashboards allow generators, transporters, service brokers and waste facilities to easily visualize and track all waste in transit from a single view.
AQMIS can provide you detailed forecasts of expected air quality conditions. AQMIS generates its own Weather Research and Forecasting (WRF) meteorological data that allows accurate 24 hr forecasts that can be used in CALPUFF or SCICHEM models to show expected plume dispersion and hotspot concentrations. AQMIS also provides the first commercially available artificial intelligence system used to forecast air quality based on historical, real-time and forecast meteorology combined with measured pollutant concentrations at ambient air monitoring stations. The system is trained using historical data sets. As the amount and quality of available data increases, the neural net learns and adapts its forecasts to become more accurate in subsequent forecasting. The forecast conditions are immediately available on the same dashboards and data screens used for other purposes in AQMIS.
The AQMIS Air Quality Index (AQI) is used by government agencies to communicate to the public how polluted the air currently is or how polluted it is forecast to become. AQMIS reads real-time or near-real-time data to calculate the AQI for current conditions and uses artificial intelligence capabilities to forecast expected near-term AQI values. AQMIS employs significant functionality to inform the public about historical, current, and forecast AQI. Stations where the AQI is calculated are presented within the GIS/mapping, and AQI data is found in searchable dashboards and an array of data analysis tools.
AQMIS fully implements the U.S. EPA Human Health Risk Assessment Protocol (HHRAP) which defines methodologies for conducting human health risk assessments including cancer and non-cancer health effects. AQMIS users are able to run risk analysis cases for desired locations and view results visually within the GIS/mapping display. AQMIS also supports more specific risk requirements and criteria such as prioritization of facilities for risk assessments; for example, following prioritization guidance used in the state of California.
AQMIS allows you to visualize project data in a geospatial environment using our proprietary GIS and mapping module. Since GIS tools are included with the software, you don’t need to purchase third-party GIS utilities in addition to AQMIS – although you can connect with popular third-party tools if you have them. The AQMIS GIS/Mapping tool is fully compatible with ESRI products and can export generated maps in SHP format. The GIS/Mapping module provides satellite imagery for your project locations, overlaid by your geospatial data where you have full control over the layers and objects displayed. An array of data can be displayed on your map, ranging from facilities and release points to the air quality index and air dispersion modeling contours.
The extensive Permitting and Compliance module in AQMIS provides you with the tools you need to manage your permitting and compliance requirements for large numbers of users and facilities. The system is designed to provide all the tools, forms, reports and automation necessary to streamline the collection of permitting and compliance data from all sources. AQMIS can be used to track the application and development of permits, issue permits to facilities, monitor stack testing and related activities, handle complaints and exceedances, and many other tasks; all of this is accomplished within a single application.
The AQMIS Calendar and Ticketing Module supports all your project management and scheduling needs. Users can manually create system tickets to track progress and set due dates for specific tasks. Take advantage of built-in functions to automatically generate and assign a customizable set of tickets for tasks when wizards or other tools are executed, triggering the requirement for the next set of defined activities. The calendar and its associated screens allow you to see an up-to-date view of tasks which are pending, in progress, or overdue, as well as who is responsible for the completion of each task.
The AQMIS Reporting module provides a complete internal reporting system that requires no third-party system. The Reporting module allows you to prepare products with advanced options ranging from professionally formatted standard reports to fully customizable ad-hoc reporting. Report types include textual and graphical reports, tabular summaries, as well as GIS-based mapping and data visualization capabilities. Data summaries can be customized using numerous queries and reporting tools to summarize results across varying levels of granularity, and all reports are fully searchable. The Reporting module provides all functionality for analyzing the abundance of data securely stored in the database combined with the ability to run reports and prepare printed or electronic copies. Electronic reports can be saved to many common file formats including PDF, CSV, Microsoft® Excel, Microsoft® Word, XML and image formats. Dozens of pre-configured report templates are available in addition to the capability to create and save ad-hoc reports.
AQMIS includes an extensive array of tools for systems administration. These tools focused on user management, utilize role-based access rights to define the screens, objects, and inventories which a given user or group is permitted to access. The portal section of the module supports the secure transmission of data between public and internal versions of the software. Individual components of data can be marked as confidential or tagged with custom properties. All changes to system data and all system access is logged and available to system administrators for review at any time. The extensive customization options available include defining custom fields and default values, specifying account and password management options, and configuring system notifications.
Dashboards
Dashboards Benefits
Main Dashboard
The Main Dashboard provides users with concise summary level information including:
- The active emission inventory year
- Count of facilities in the inventory
- Count of release points
- Count of pollutants
- Media totals for air, water, wastewater, solid waste
- Emission totals by defined geopolitical boundary (e.g., county, region, state) or facility
- Interactive Map showing airsheds, regions, and facility locations
- Emissions graphs by pollutant and county or facility
Easy to use navigation tools as well as advanced search and filtering options allow users to quickly find the information they are looking for.
Users can customize their dashboards to view the information they are most interested in. For example, users can select the list of pollutants to display such as criteria, toxics, or GHGs.
.png)
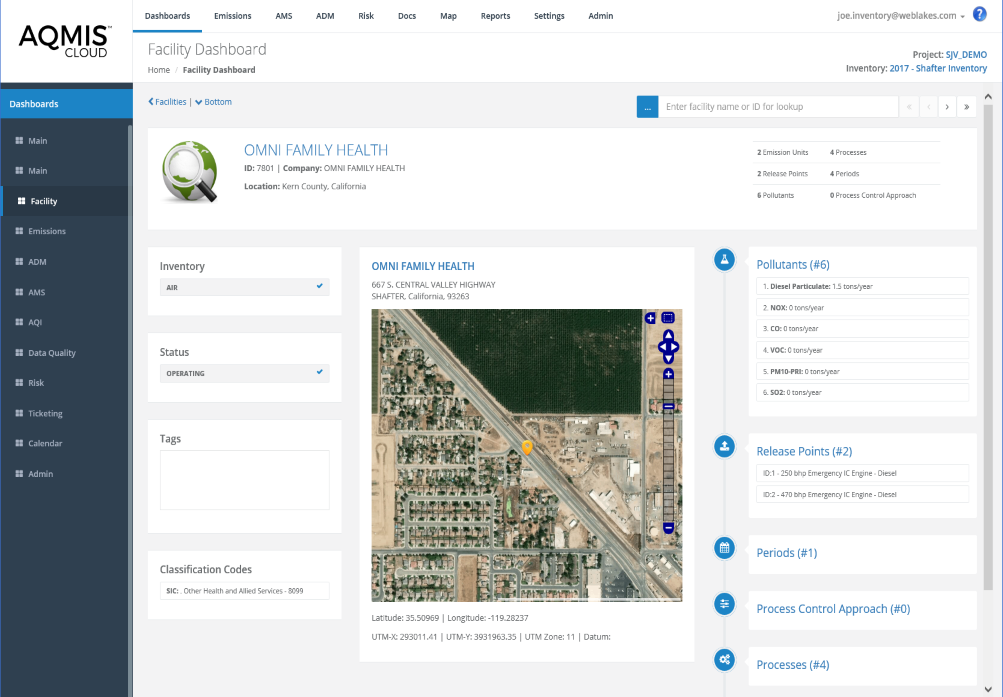
Facility Dashboard
The Facility Dashboard provides users with concise summary level information about the selected facility including:
- Facility ID
- Description
- Count of pollutants
- Release Points
- Emissions Controls
- Emissions Units
- Classification Codes
- Interactive Map
- Location
- Governing regulatory agency
- Applicable media
- Emissions periods
- Processes
- Status
- Primary facility contact
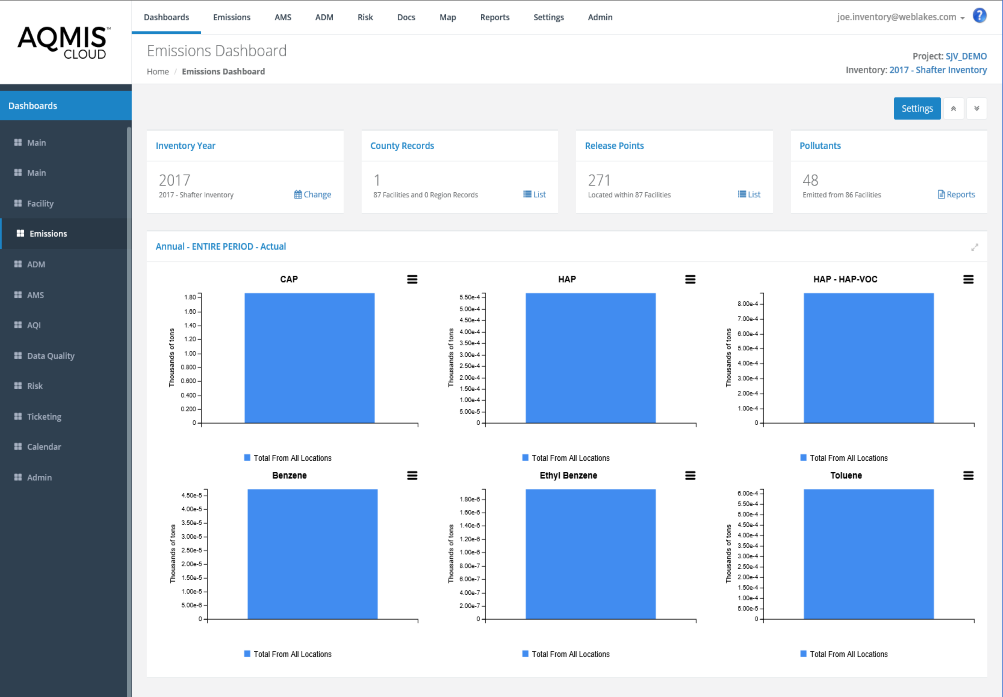
Emissions Dashboard
Visualize and analyze emission inventory data in a multitude of ways including:
- Data aggregation by:
- Source types
- Regional Designations
- Attainment Zones
- Facilities
- Emission sources
- Pollutants By Category
- Temporal analytics and trending
- Trend analysis over multiple inventory years
- The emissions dashboard is user customizable to meet the specific requirements of your role and responsibilities. For example, you may be interested in air toxics while someone else may be responsible for managing GHGs or criteria pollutants
- Generate formatted reports for online visualization or export data in common formats including PDF, Microsoft® Excel, Microsoft® Word, CSV, XML, and Tiff
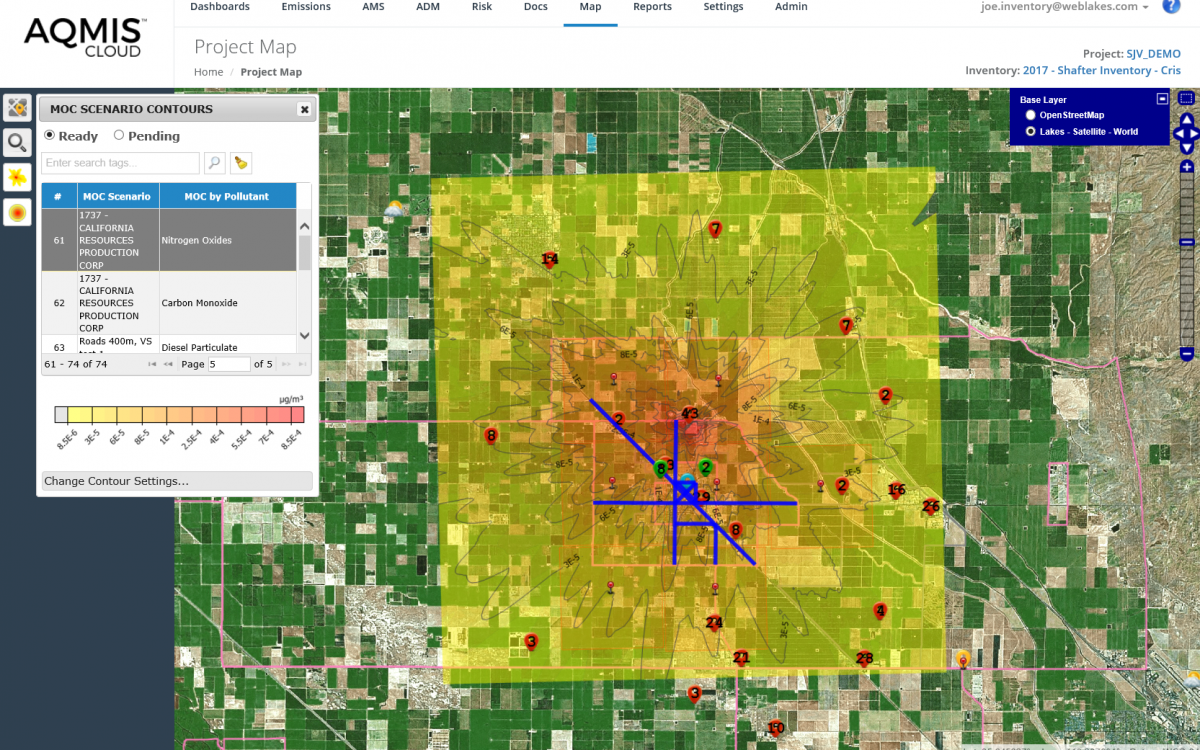
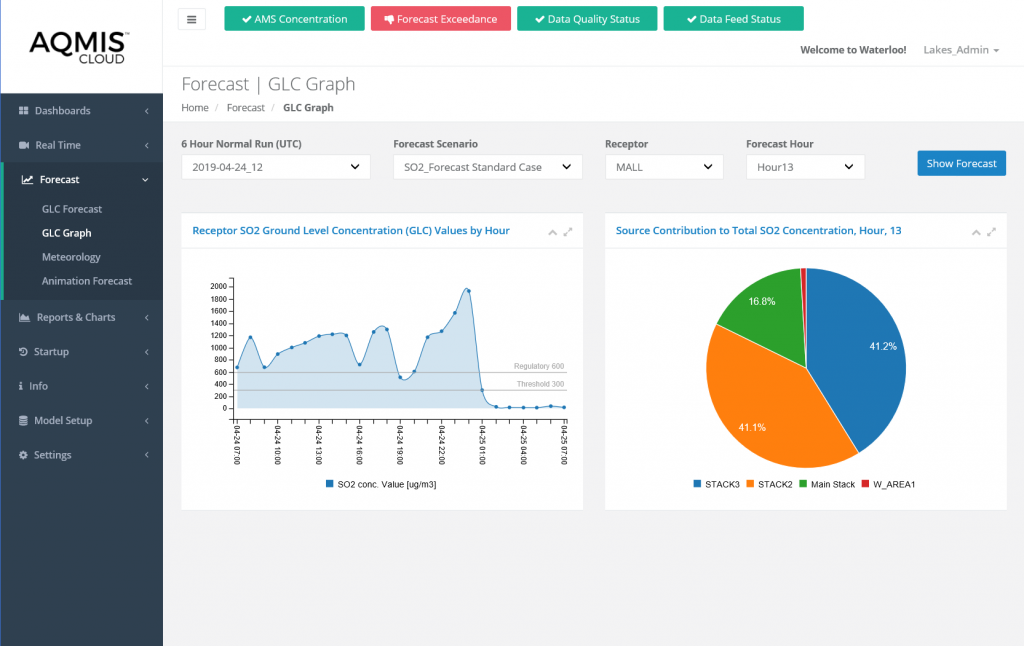
Air Dispersion Modelling Dashboard
- The Dispersion Modeling (ADM) Dashboard provides users with concise information on the location and magnitude of pollutant-specific modeled air concentrations including:
- Maximum pollutant-specific concentrations
- Maximum offsite concentration
- Concentration gradient contour map
- Percent of applicable regulatory standards
- User selectable library of air dispersion modeling scenarios including Historic, Real-Time, and Forcast.
- Source attribution profiles are provided to identify which emissions sources or source groupings are causing the highest impacts across the modeling domain
- View multiple inventory years, trends, and comparison of modeled versus measured.
- Concentration contours are automatically generated and visible on the map. Users can easily customize contour settings such as color ramps, contour intervals, index values, labels, and color outlines.
- Pollutant contour maps can be viewed online or exported to share with additional stakeholders

Ambient Monitoring Station (AMS) Dashboard
- Quickly identify exceedances of regulatory thresholds (e.g., Criteria Pollutants) or other user defined target levels
- Identify areas within the network with the highest and lowest pollutant concentrations
- Visualize data trends to identify temporal and spatial correlations
- Visualize ambient air monitoring data in a multitude of ways including:
- Time series bar charts
- Line charts
- Wind rose plots
- Pollution rose plots
- Pollution rose plots make it easy to identify upwind sources impacting the ambient monitor
- Perform trend analysis by plotting multiple years of data
- Visualize temporal patterns including seasonal or daily fluctuations in air concentrations
- Charts are interactive where users can highlight specific data and turn data elements on an off to customize the display of results
- Automatically calculate an Air Quality Index (AQI) to inform the public on the current and forecasted levels of air pollution

Air Quality Index (AQI) Dashboard
The air quality index is a number used by government agencies to communicate to the public how polluted the air currently is or how polluted it is forecast to become. As the AQI increases, an increasingly large percentage of the population is likely to experience increasingly severe adverse health effects. The AQI value ranges beteen 0 – 500.
The AQI dashboard provides calculated AQIs for all active ambient air monitors following the U.S. EPA calculation method. Available results include historic, current and forecasted AQI. The following information is provided so people can plan accordingly to limit their exposure to air pollution:
- Overall AQI score
- AQI score for individual pollutants
- Health Effects
- Who should be worried?
- What should you do?
- Trend charts and graphs for the past 24 hours
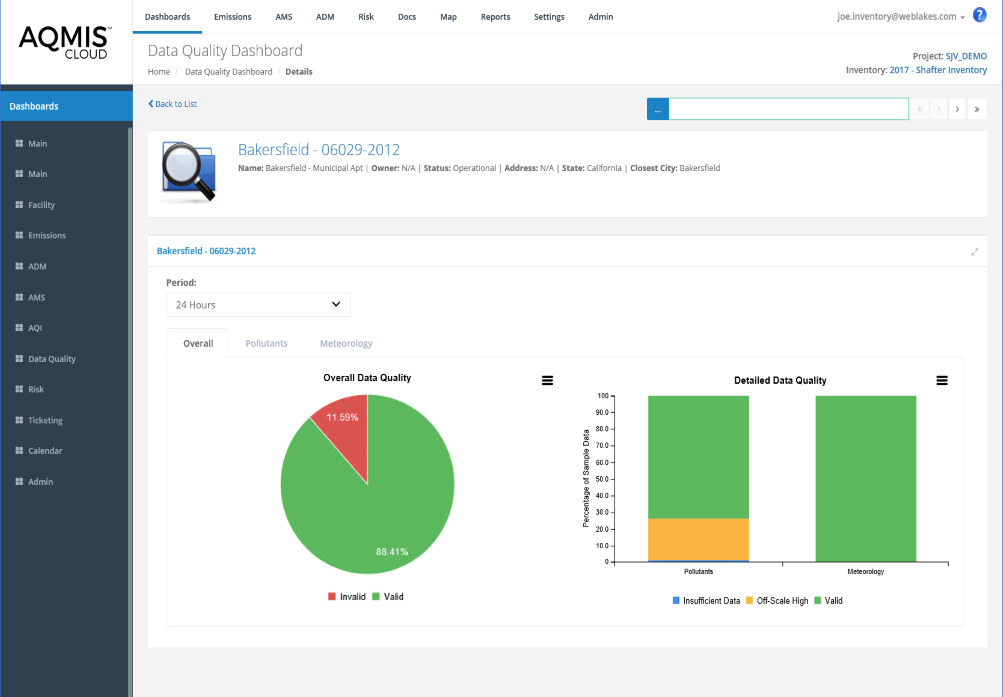
Data Quality Dashboard
The Data Quality Dashboard provides a summary of data quality including completeness (the amount of data present or missing) and validity (is the data of acceptable type and within an acceptable range). Data quality classifications include:
- Good (Valid Data > 75%)
- Bad (Valid Data 50-75%)
- Critical (Valid Data < 50%)
- Disconnected (No Data)
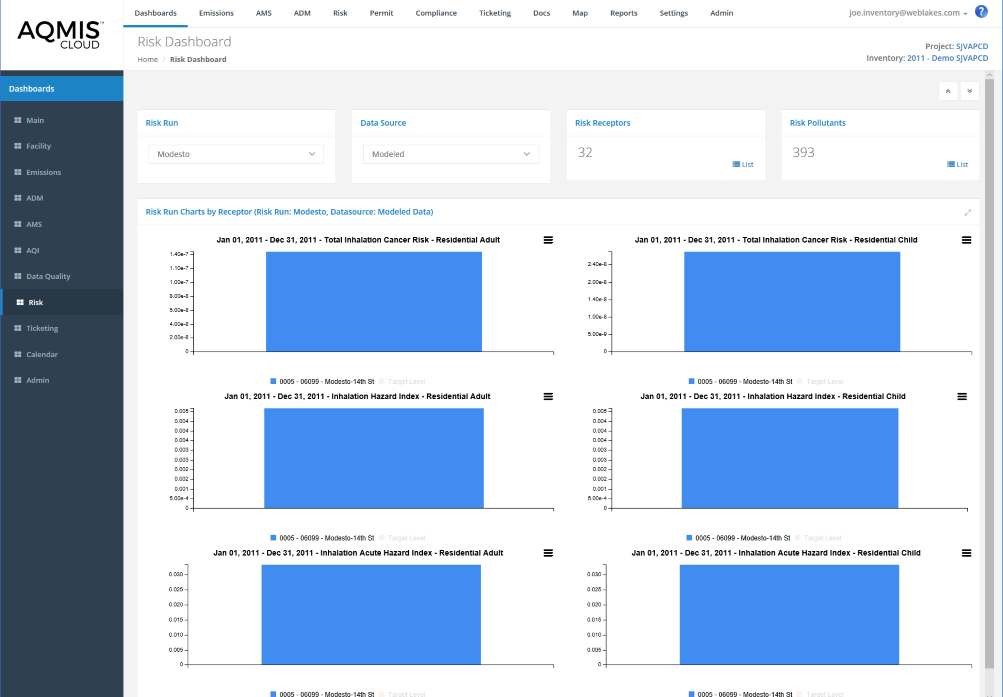
Risk Dashboard
- The Human Health Risk Assessment (Risk) Dashboard provides users with concise information on the location and magnitude of pollutant-specific human health risks including:
- Chronic cancer risk
- Chronic non-cancer hazard
- Short-term acute
- Data visualization includes identification of cumulative and by pollutant specific cancer risks and hazards, including consideration of applicable regulatory risk target levels.
- Exposure scenarios include:
- Resident Adult and Child
- Fisher Adult and Child
- Farmer Adult and Child
- Exposure pathways include direct inhalation and indirect ingestion.
- The graphs include regulatory risk target levels to quickly identify risks that are above target levels of concern.
- Human health risk can be calculated using modeled or measured pollutant concentrations.
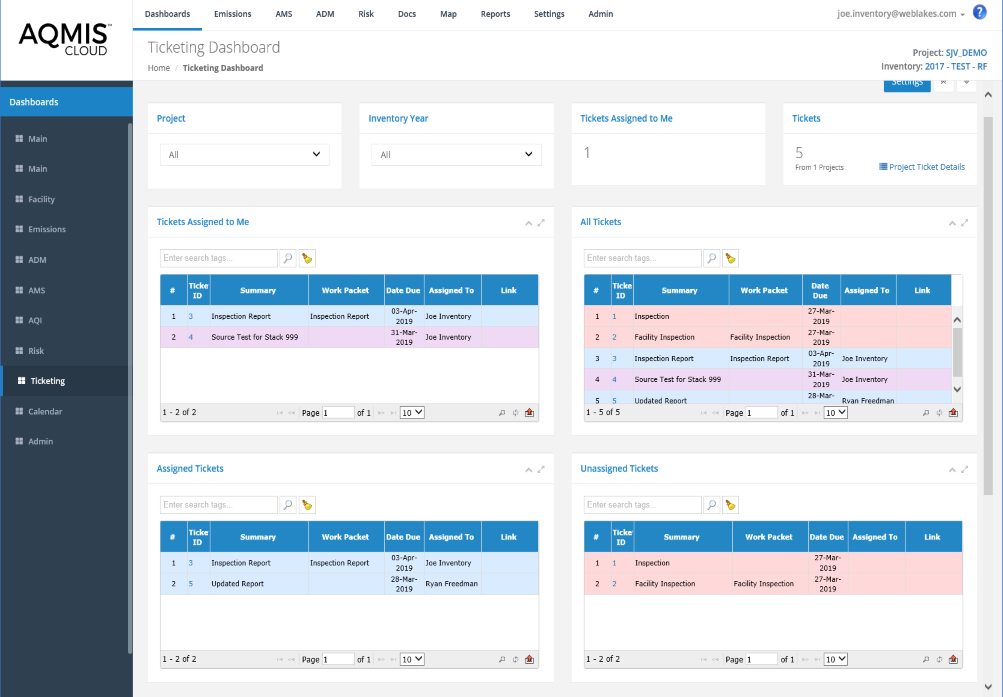
Ticketing Dashboard
The Ticketing Dashboard provides a summary of tickets managed within the system and their current status including:
- Tickets Assigned to Me
- Tickets Submitted by Me
- All Tickets
- Assigned Tickets
- Unassigned Tickets
- Overdue Tickets
Each ticket is color coded to provide further information regarding its status. Users can search for tickets and apply multiple tags to further filter the information that is provided.
Calendar Dashboard
The Calendar Dashboard provides a summary of tickets based on the dates they are due or were completed. Tickets are color coded to identify the assigned status. Users can click on tickets to quickly access the details. The calendar can be viewed by Month, Week or Day.

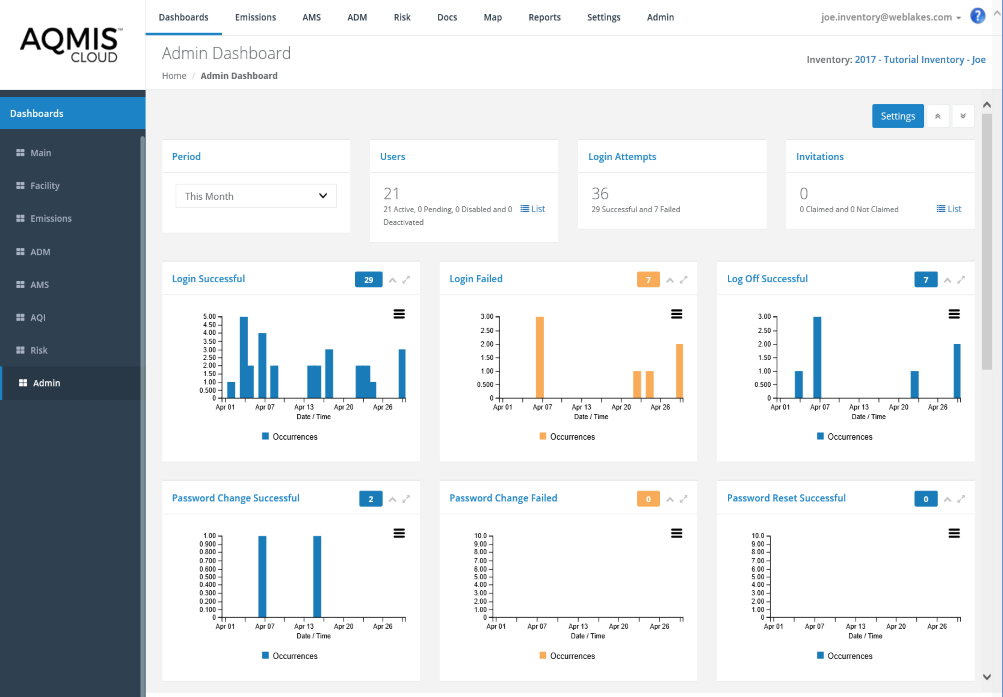
Administrative Dashboard
The Systems Adminstration Dashboard provdies authorized users with concise adminstrative information including:
- Login statistics including
- Successful
- Login failed
- Log off successful
- Password management including:
- Change successful
- Password change failed
- Password reset successful
- Password reset claim successful
- Password reset claim failed
- Project selection successful
- User Invitation Management
- User locked out
- User unlocked
- User invite sent
- User invitation claimed
- Shadow user Management
- Shadow user log on successful
- Shadow user log off successful
- Interactive and users customizable summary charts and graphs
Contact Us