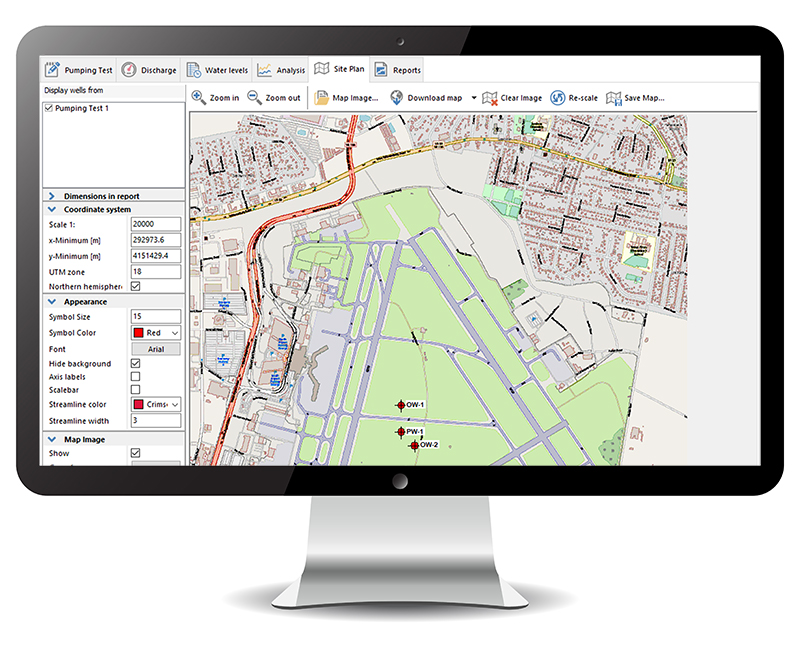
AquiferTest


Pumping & Slug Test Analysis, Interpretation & Visualization Software
Built for Hydrogeologists by Hydrogeologists

Built for Hydrogeologists by Hydrogeologists. AquiferTest offers an easy-to-use graphical interface

AquiferTest is an easy-to-use software package for analyzing, interpreting and visualizing pumping and slug test data. AquiferTest offers all the tools needed to accurately interpret data from all types of aquifers in all types of test conditions.


AquiferTest Applications Include

  • Groundwater resource evaluations
  • Determine groundwater Hydraulics
  • Pumping test data evaluation
  • Slug test reporting
  • Interpret Lugeon test data
  • Derive the fundamental hydrogeologic parameters affecting groundwater flow

Why Choose AquiferTest?


AquiferTest offers an easy-to-use graphical interface

Analyze test data from pumping tests, slug tests and Lugeon tests via seamless integration with water level instrumentation.

Easy and Flexible Data Importing

Save time and go straight to the analysis with flexible data import options.

Automatic type curve fitting

Show type curve families on analysis graphs for enhanced visual curve matching of complex aquifer conditions arising from variable pumping rates, aquitard storage and boundary effects.

Colour contouring and color shading

Gain a deeper understanding of your test data and take your reports to the next level with colourful contour maps showing drawdown data and well interference over aerial and satellite site maps.

Barometric and baseline trend correction

AquiferTest Pro provides pre-processing tools that ensure your water levels are corrected for baseline trends (trend effects) and barometric pressure changes.

Diagnostic plots for choosing the best analysis

AquiferTest provides a set of powerful diagnostic plots that help you easily identify model assumptions and select the most appropriate analytical solution for your pumping test data.

An Extensive Suite of Analytical Tools

AquiferTest delivers an extensive set of solutions suitable for all types of aquifers and test conditions. Analyse confined, unconfined, leaky, and fractured aquifers.

Built for hydrogeologists by hydrogeologists, AquiferTest offers an easy-to-use graphical interface

  • Analyze test data from pumping tests, slug tests and Lugeon tests via seamless integration with water level instrumentation.
  • A comprehensive suite of analysis methods and solutions suitable for all types of aquifers including confined, unconfined, leaky and fractured aquifers.
  • Easily account for various well conditions including wellbore storage, horizontal wells, and single well analyses.
  • Predictive water table drawdown at planned well locations, and customizable professional-quality analysis reports.
  • Print-ready reports of your data and analyses are automatically generated for you!

AquiferTest Pro provides additional features:

  • Advanced pre-processing tools for barometric compensation and trend correction.
  • Diagnostic plots and derivative analysis for identifying aquifer conditions from test data.
  • Simplified contour plots and streamlines of drawdown solutions, and automatic type curve matching.

Easy and Flexible Data Importing

Save time and go straight to the analysis with flexible data import options. Quickly import field data from common file formats and virtually any groundwater datalogger on the market.

  • Text(.TXT)
  • Excel (XLSX)
  • ASCII Datalogger (.ASC, .TDxt)
  • Level Logger (.LEV)
  • Diver Datalogger (.MON)

Automatic type curve fitting

Show type curve families on analysis graphs for enhanced visual curve matching of complex aquifer conditions arising from variable pumping rates, aquitard storage and boundary effects.

Colour contouring and color shading

Gain a deeper understanding of your test data and take your reports to the next level with colourful contour maps showing drawdown data and well interference over aerial and satellite site maps.

Barometric and baseline trend correction

AquiferTest Pro provides pre-processing tools that ensure your water levels are corrected for baseline trends (trend effects) and barometric pressure changes.

Diagnostic plots for choosing the best analysis

AquiferTest provides a set of powerful diagnostic plots that help you easily identify model assumptions and select the most appropriate analytical solution for your pumping test data.

Automatic analysis reports

Automatically transform raw analyses to professional-quality reports that include your company logo, name, project information, well data, analysis graphs and site maps. Reports templates can be customized exactly the way you want them, and saved as PDFs for easy sharing.

An Extensive Suite of Analytical Tools

AquiferTest delivers an extensive set of solutions suitable for all types of aquifers and test conditions. Analyse confined, unconfined, leaky, and fractured aquifers. Account for various well conditions including wellbore storage, horizontal wells, and single-well analyses.

Modules/Analytical Methods

AquiferTest Modules and Complete list of Analytical Methods

AquiferTest Feature Comparison

Features Standard Pro
Standard Pumping Test Solutions
Pumping Test Recovery Analyses
Standard Slug Test Solutions
Lugeon Test (Packer Test)
Fully or Partially Penetrating Wells
Single or Multiple Pumping Wells
Constant or Variable Pumping Rates
Aquifer Bounded by Barrier or Recharge Boundary
Isotropic or Anisotropic Aquifer
Well Effects (well bore storage)
Fracture Flow Solution (Moench, Warren-Root)
Well Performance Solutions (Specific Capacity, Hantush-Biershenk)
Plotting Wells on a Site Map
Derivative Smoothing
Horizontal Wells (Clonts & Ramey)
Well Skin effects (Agarwal)
Plotting/Contouring Drawdown on a Site Map
Trend Effects / Barometric Correction
Multi-Layered Aquifer Analysis

An extensive suite of analytical methods

AquiferTest delivers an extensive set of solutions suitable for all types of aquifers and test conditions. Analyse confined, unconfined, leaky, and fractured aquifers. Account for various well conditions including wellbore storage, horizontal wells, and single-well analyses.

  • Drawdown Plots
    • Time Drawdown Plot
    • Time Drawdown-Discharge Plot
  • Pumping Tests
    • Theis (1935) – confined, isotropic aquifer
    • Theis with Jacob Correction (1944) – unconfined, isotropic aquifer
    • Boulton (1963) – unconfined, anisotropic aquifer
    • Neuman (1975) – unconfined, anisotropic aquifer, partially-penetrating well
    • Hantush-Jacob (Walton, 1962) – leaky aquifer
    • Hantush (1960) -leaky aquifer, with storage in aquitard
    • Warren Root (1963) – dual porosity, fractured flow
    • Moench (1984, 1988) – fractured flow, with skin
    • Papadopulos & Cooper (1967) – well bore storage/large diameter wells/single well
    • Agarwal Recovery (1980) – recovery analysis
    • Clonts and Ramey (1986) – horizontal wells
    • Neuman and Witherspoon (1969) – confined, two-aquifer system
    • Hemker and Mass (1987) – multi-aquifer system
    • Theis Recovery (1935) confined
    • Cooper Jacob:
      • Type I: Time-drawdown
      • Type II: Distance-drawdown
      • Type III: Time-distance-drawdown
  • Well Performance
    • Specific Capacity - Hantush-Bierschenk (Hantush, 1964; Bierschenk, 1963):
      • Well loss
      • Well efficiency
  • Other Analysis Tools
    • Derivative Plots
    • Diagnostic Plots
    • AquiferTest Method Selection Advisor
  • Slug Tests
    • Hvorslev (1951)
    • Bouwer-Rice (1976)
    • Cooper-Bredhoeft-Papadopulos (1967)
    • High-K Butler (2003)
    • Dagan (1978)
    • Binkhorst and Robbins (1998) – effective radius
  • Lugeon Tests
    • Lugeon Tests (1933) – also known as Packer Tests

Contact Us

Address

Plot No 246, Road No 78,
Jubilee Hills,
Hyderabad - 500033,
Telangana, INDIA

Call Us

+91 40 2354 9924
+91 40 2354 8905

Email Us

info@lagasys.com
sales@lagasys.com
support@lagasys.com