Column & Bar Charts (Basic, Stacked,
Grouped)
Floating Column & Bar, Bridge
Plot
2D Pie and Doughnut Charts
Line, Scatter, Line+Symbol Plots
Lollipop, Density Dots, Area Plots
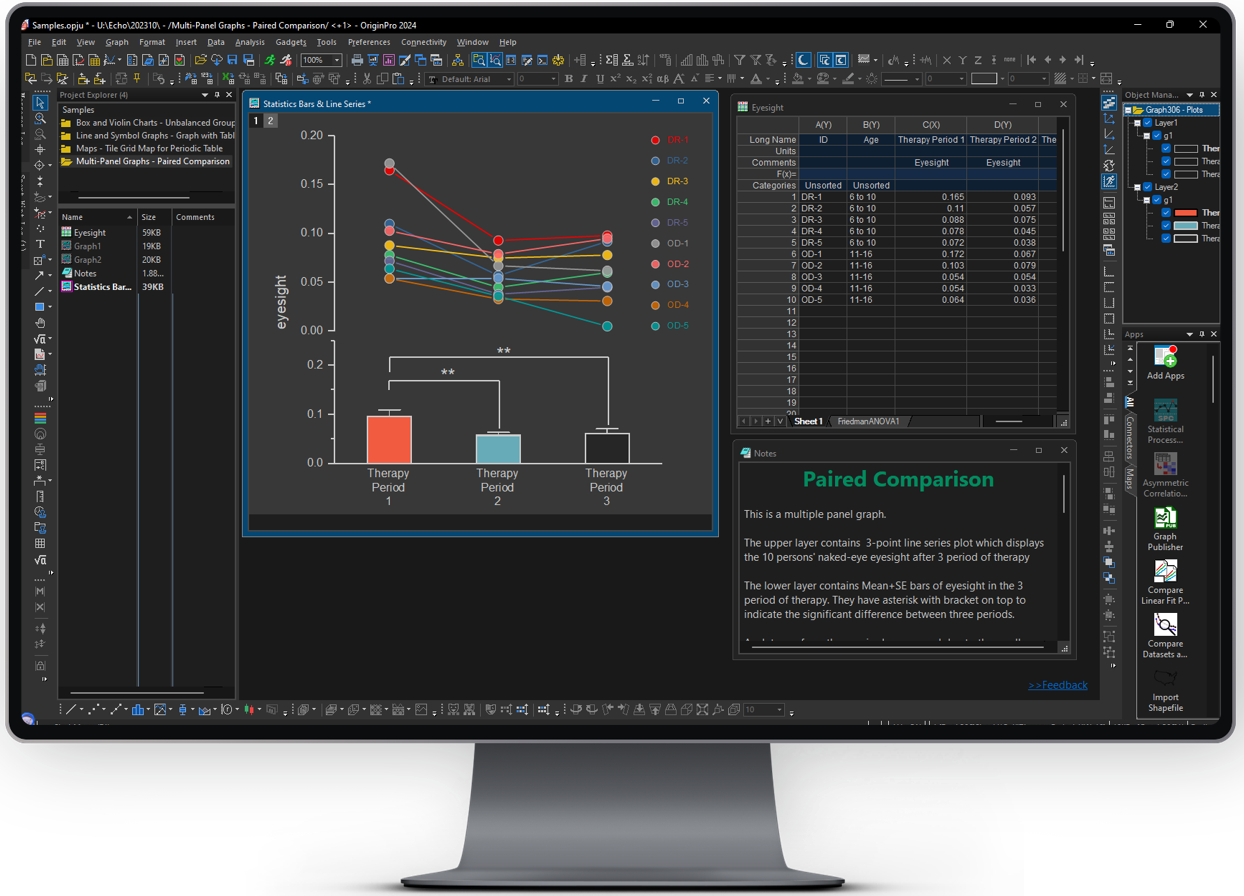
Multi-Axis & Multi-Panel, Trellis
Plot
Polar, Radial, Waterfall, Contour &
Heatmap
Vector, Streamline, Wind Rose, Spiral
Bar
Spider/Radar, Smith Charts, Stiff &
Durov Diagrams
Stock Plots, Profile Plot, Image
Plot
Box Chart, Violin Plot, Histogram
Scatter Matrix, CDF, Kernel Density
Plots
Probability & Q-Q Plots, Control
Charts
Dot Plot, Pareto, Parallel, Sankey &
Alluvial
Chord Diagram, Network Plot, Ribbon
Chart
Population Pyramid, Before-After,
Bland-Altman
Forest Plot, Poincaré, Voronoi
Diagram
Pie/Bar Map, Sankey Map, Polar
Quiver
3D Surface, 3D Bar, 3D
Scatter/Trajectory/Vector
3D Ribbons/Walls, Waterfall, Pie,
Column
3D Ternary, Stacked 3D
Heatmap/Surface
Ridgeline, Treemap, Sunburst, Circular
Packing
Hierarchical Edge Bundling, Heatmap with
Dendrogram
Manhattan Plot, Andrews Plot, Venn
Diagram
Piper, Isosurface, 3D Wind Rose, 3D
Stacked Histograms
Soil Classification, Interaction Plot,
Run Chart
2D/3D Function & Parametric Function
Plots