

Visualize Data
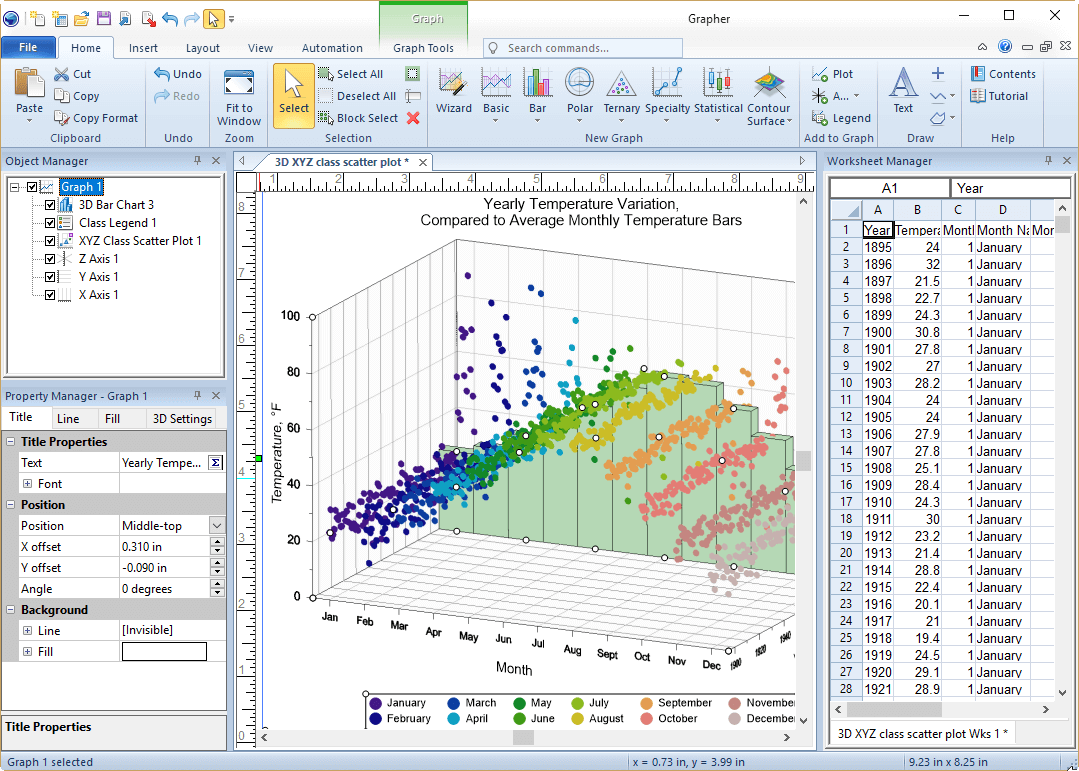
Present your data at its best. Grapher offers high-quality graphing tools so you can get the most out of your data. Grapher provides over 70 different 2D and 3D graphing options to best display your data.
Overview
Present your data at its best. Grapher offers high-quality graphing tools so you can get the most out of your data. Grapher provides over 70 different 2D and 3D graphing options to best display your data.
Don’t miss any opportunity. Your data may be hiding valuable information. Utilize Grapher’s extensive analysis charts, tools, and statistical features to identify trends, find new insights, and locate opportunities. Grapher provides a holistic view of your data.
Grapher’s extensive selection of graph types and innumerable customization options allow you to communicate your complex ideas in a format that your audience will easily understand. Let your data do the talking with Grapher.
Grapher is trusted by thousands of scientists, engineers, and business professionals across the globe. Experience Grapher for yourself and see why so many people trust Grapher to display their data.
Expert advice and learning is a click away. We're here to help you through every stage of your project.
Features
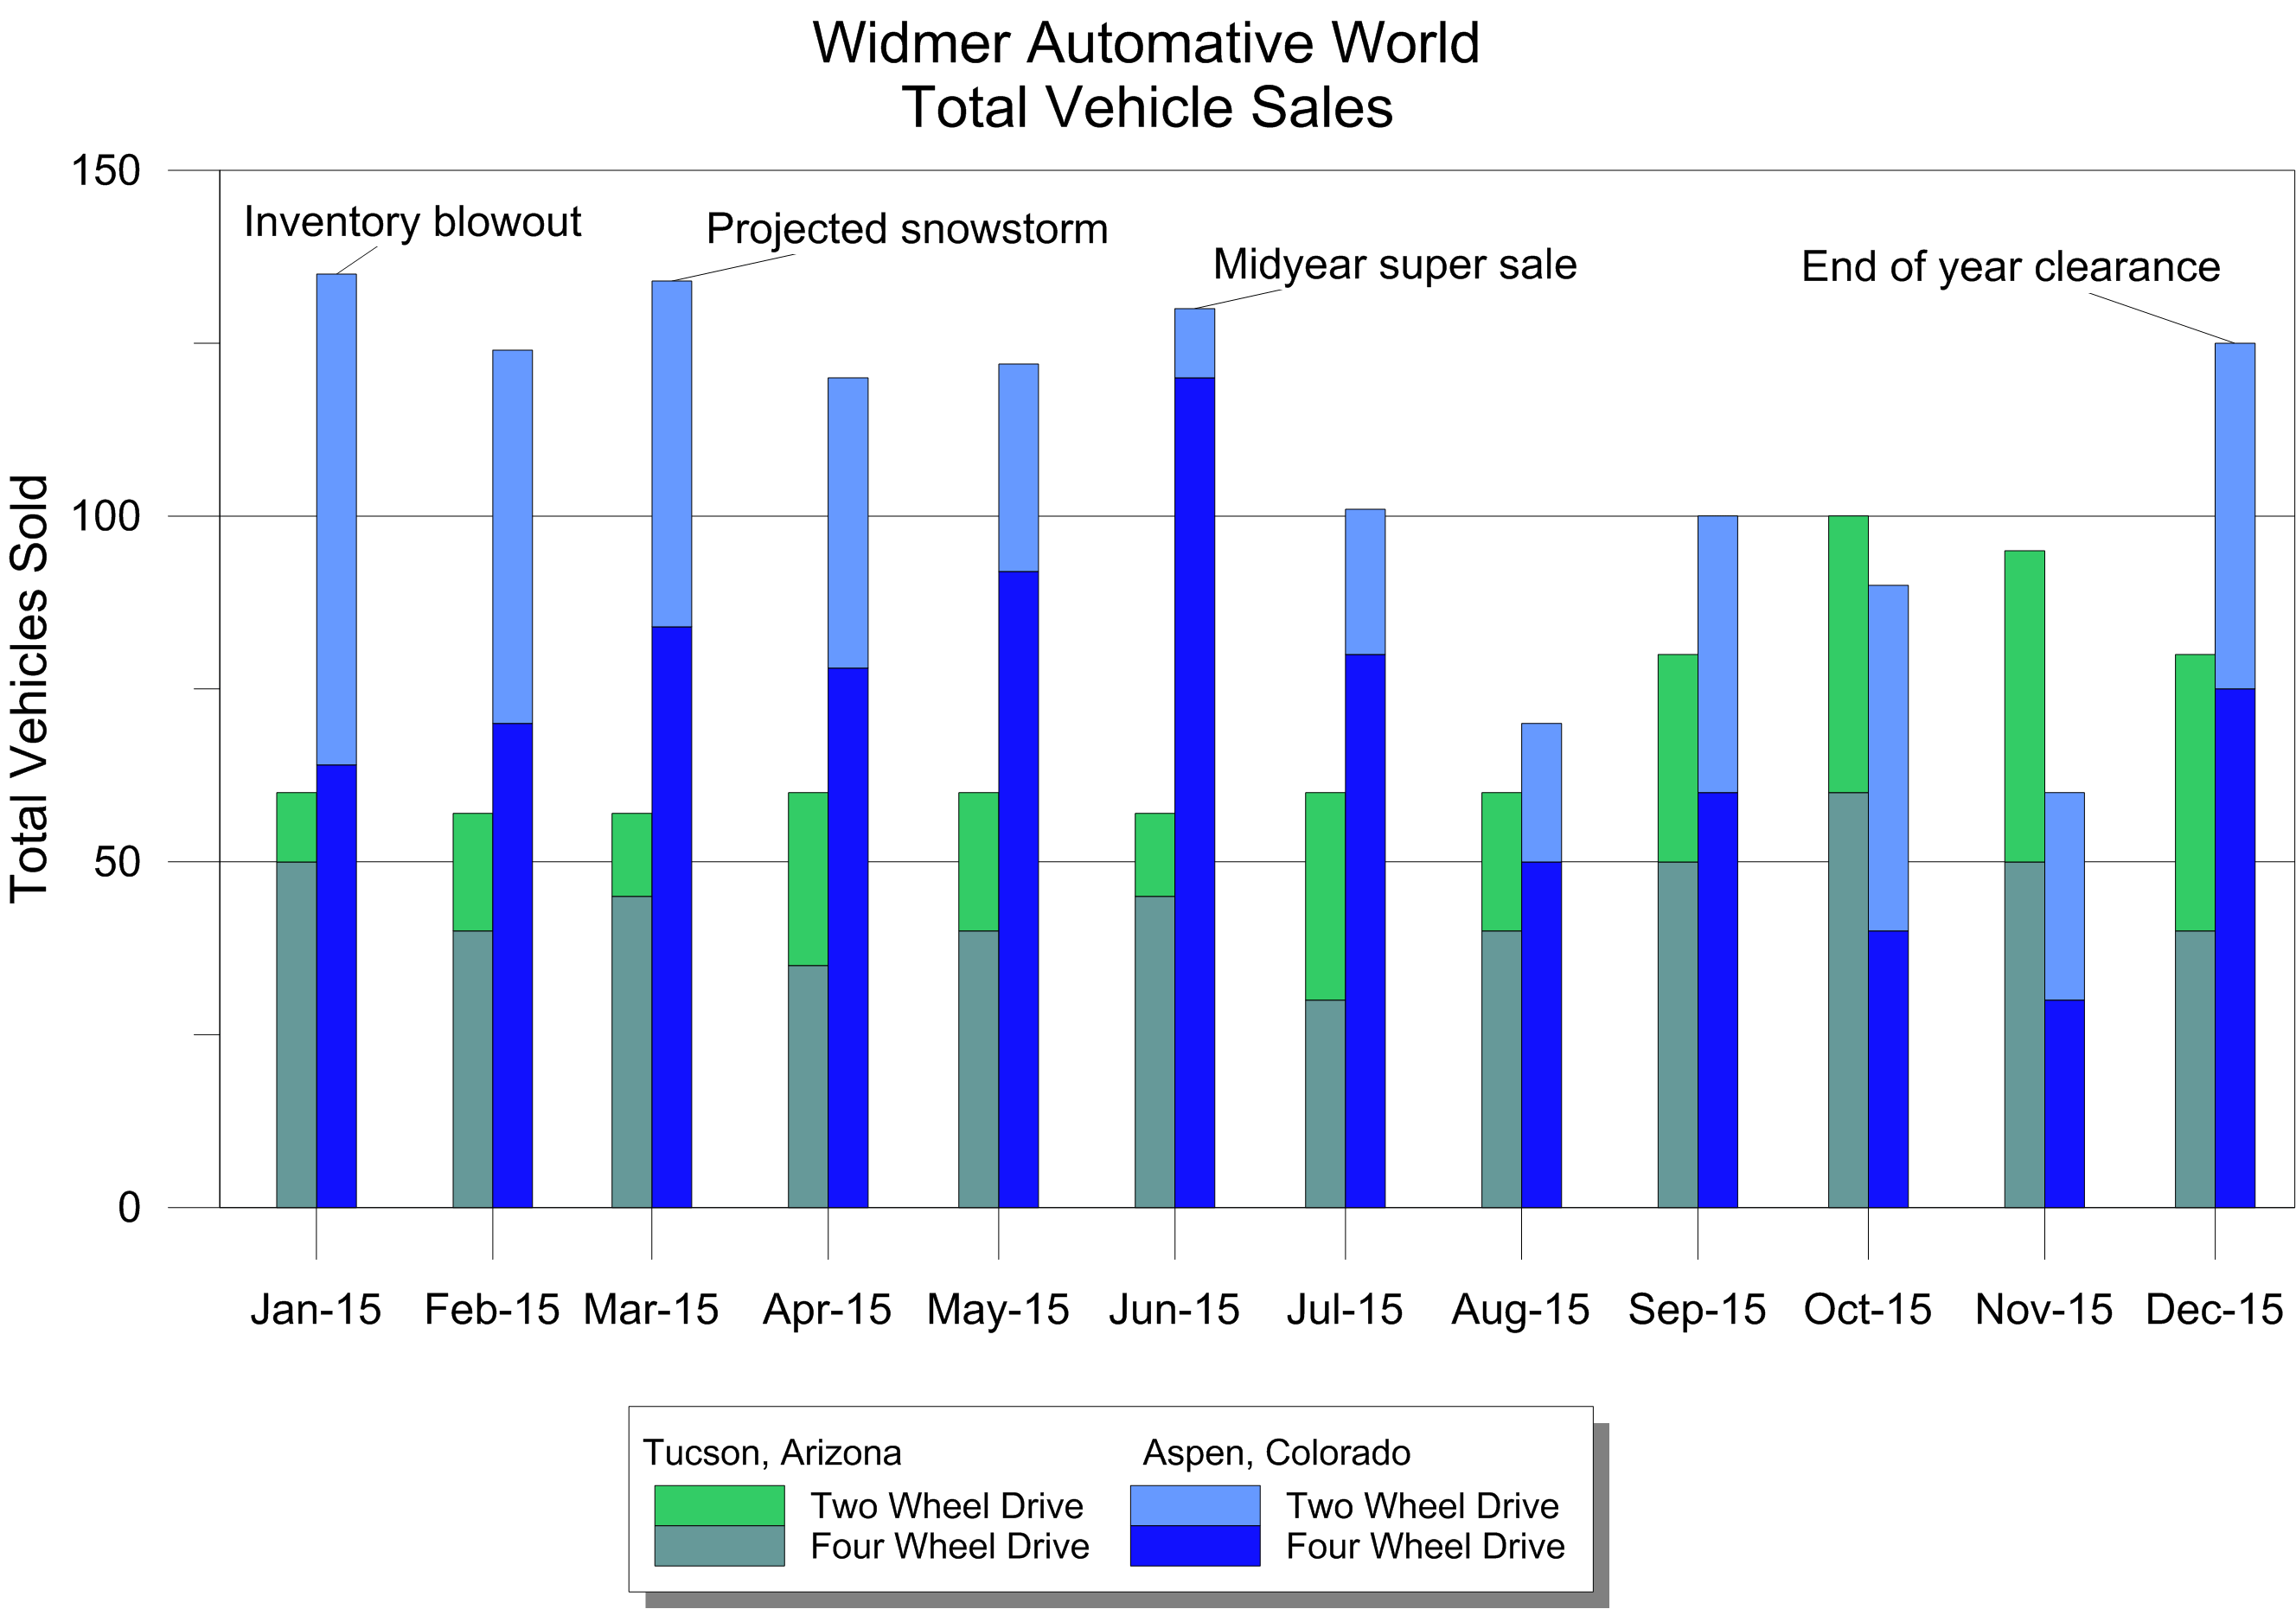
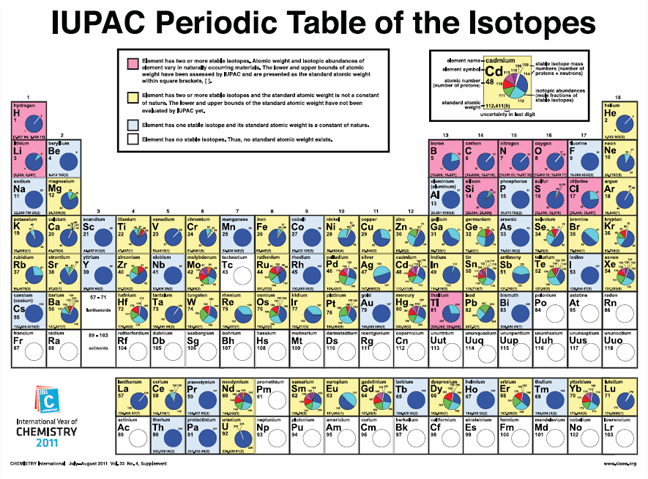
Quickly create stunning and informative 2D and 3D graphs. Choose from over 70 different graph types and communicate your message to any audience with Grapher's extensive graphing abilities.
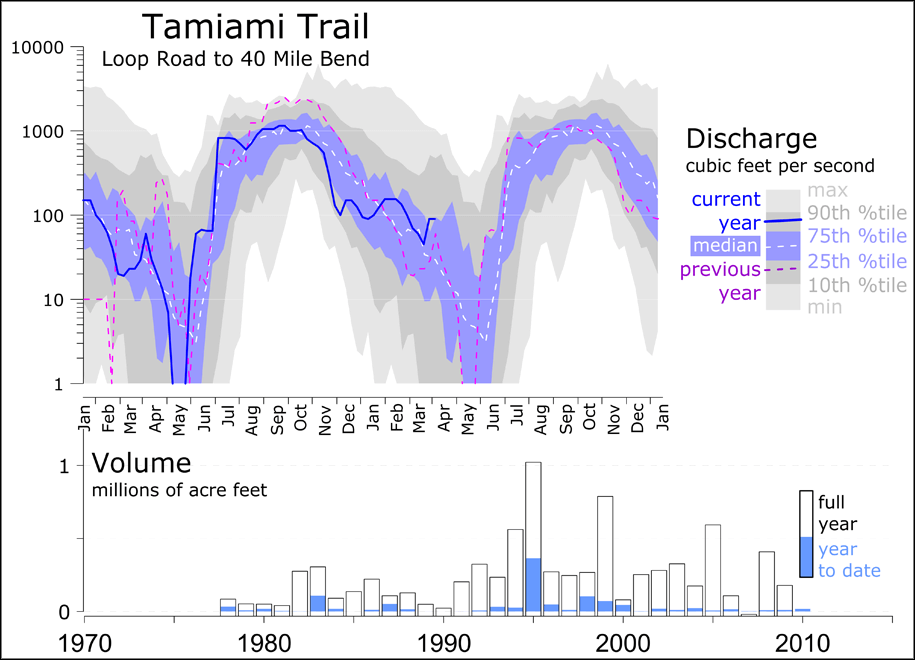
Control every aspect of your plot down to the smallest detail. Grapher’s extensive customization options allow you to convey complex ideas in an easy-to-understand manner. Grapher displays your data at its very best.
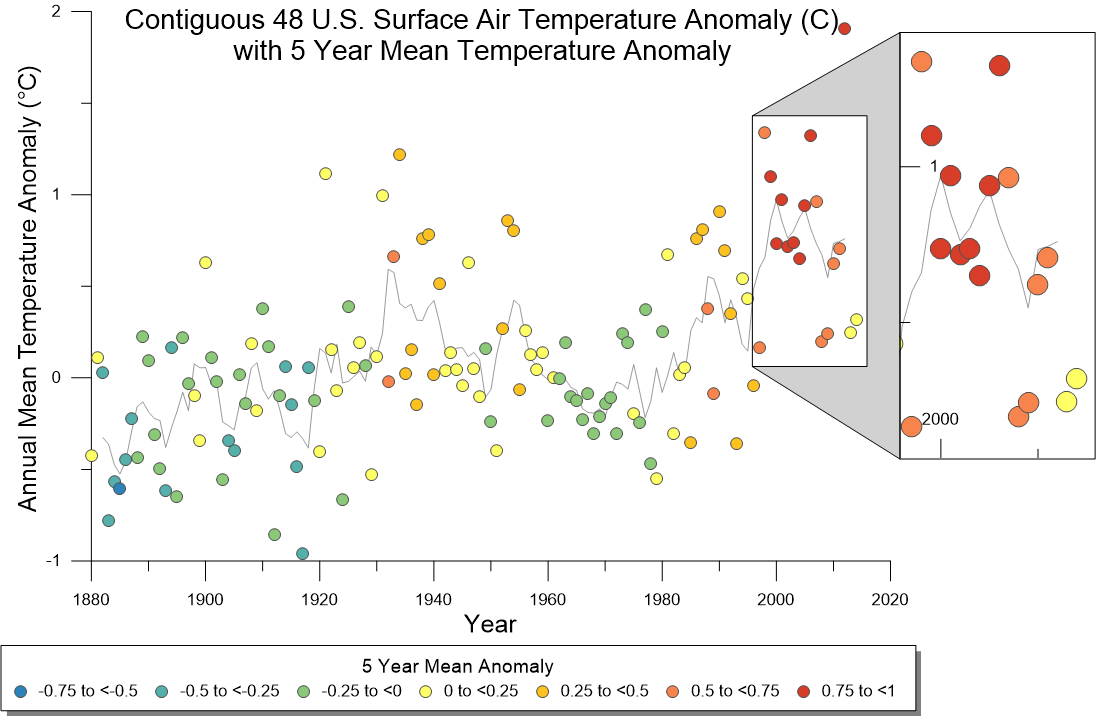
Make informed decisions with Grapher. Discover new opportunities and trends hiding in your data with Grapher’s statistical tools. Add custom or pre-defined fit curves, error bars, or compute statistics on the raw data for a thorough understanding of the underlying trend.
Quickly share your charts with colleagues, stakeholders, and clients. Get your graphs ready for printed publications by exporting to high quality formats like PDF or TIFF, or share your work online by exporting to PNG or SVG formats. Alternatively, Grapher makes it easy to insert diagrams into presentation tools such as Microsoft Word or PowerPoint with a simple copy and paste.
Get up and running in matter of minutes. Grapher’s user interface was designed to take the guesswork out of learning a new program. We worked hard streamline workflows so you don’t have to.
Don’t waste time doing the same process over and over. Create scripts to automate repetitive tasks, and run your favorite scripts directly from the Grapher ribbon. Grapher can be called from any automation-compatible programming languages such as C++, Python, or Perl. Grapher also ships with Scripter, a built-in Visual Basic compatible scripting tool. Better yet, use the script recorder to transform actions performed in Grapher into a script.

Seamlessly visualize and analyze data from multiple sources. Grapher natively reads numerous file formats including ACCDB, DBF, and XLSX. Grapher also supports most popular export formats. Easily manage all your data in Grapher.