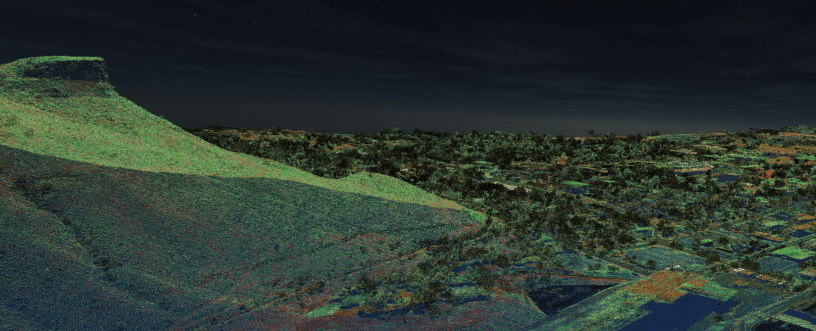
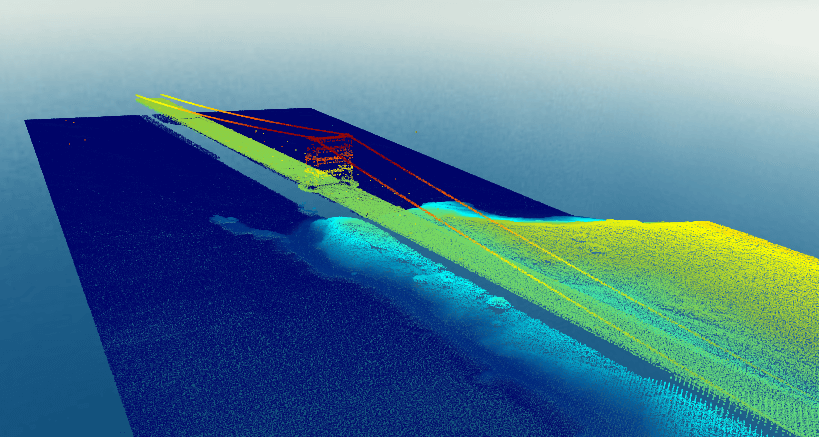
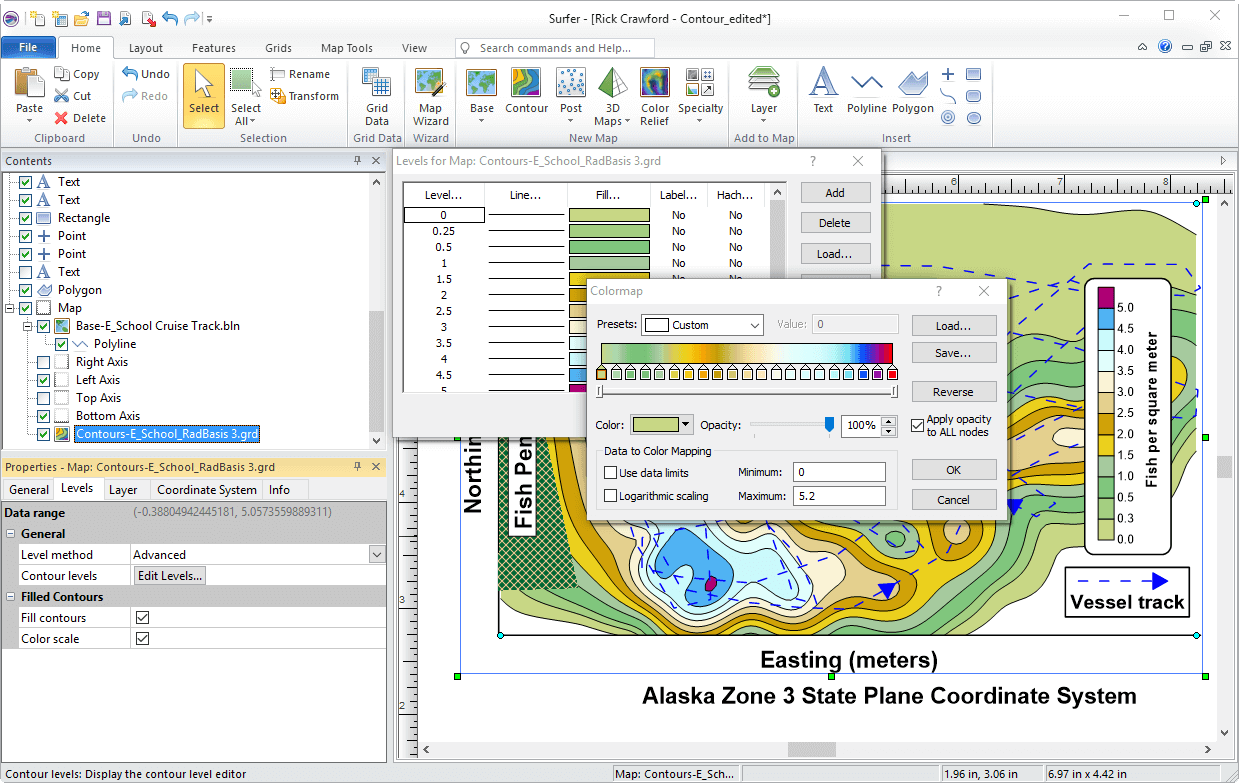
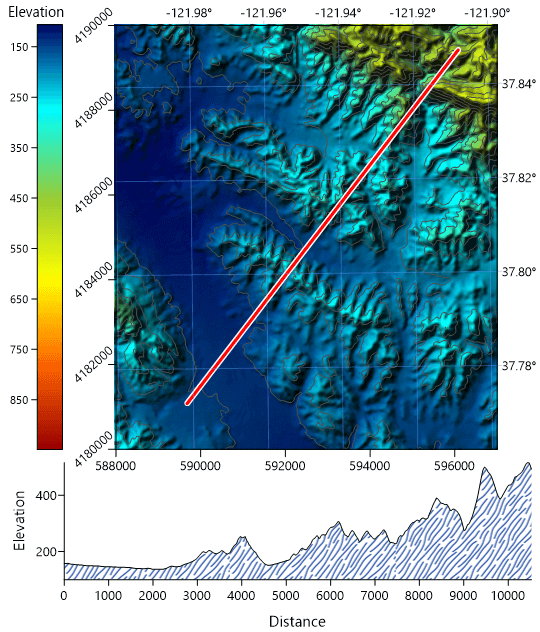
+91 40 23549924/8905

info@lagasys.com

Surfer

Explore the depths of your data.

Overview

Example blog post alt

Visualize Data

You work hard gathering your data. Don’t settle for subpar visualization. Utilize Surfer’s extensive modeling tools to display your data the way it deserves while maintaining accuracy and precision. Clearly communicate information with Surfer.


Analyze Data

Discover the depths of your data with Surfer’s numerous analysis tools. Adjust interpolation and gridding parameters, assess the spatial continuity of data with variograms, define faults and breaklines, or perform grid calculations such as volumes, transformations, smoothing, or filtering. Surfer quickly transforms your data into knowledge.

Example blog post alt

Example blog post alt

Communicate Results

Communicate your hard-earned findings with confidence. Whether it is for your project manager, thesis advisor, or client, Surfer facilitates a complete and thorough understanding of data.


Trusted Since 1983

Surfer has withstood the tests of time. See for yourself why thousands of scientists and engineers across the globe trust Surfer to display their data.

Surfer is actively used in the following industries:

  • Agriculture, Archaeology, Construction
  • Education, Energy, Environmental, Exploration
  • Geophysical, Geotechnical, Geothermal, GIS, Government
  • Maritime, Military, Mining, Mudlogging
  • Oil & Gas, Renewable Energy, UAV / UAS, Utilities, Water Resources
Example blog post alt

We Are Here to Help

Expert advice and learning is a click away. We're here to help you through every stage of your project.


Features

Example blog post alt

Create Professional Maps

Easily communicate both simple and complex spatial data. Surfer gives you the tools to create high-quality maps to clearly deliver your message to coworkers, clients, and stakeholders.

Surfer Map Types

Model Data in Multi-Dimensions

Gain deeper insights into your data when viewed in three-dimensional space. Surfer’s 3D viewer makes it easy to model, analyze, and understand all aspects of your data. Switching between Surfer’s 2D and 3D perspectives ensures you discover all of your data’s patterns and trends.

Achieve a 360⁰ Perspective
  • Rotate your map
  • Walk along the surface
  • Adjust the vertical exaggeration
  • Create and record fly-through videos to share with others

Example blog post alt

LiDAR Point Clouds

LiDAR is an increasingly popular data collection method used within many fields including archaeology, surveying, GIS, and more. Use Surfer’s extensive LiDAR processing and visualization features to take advantage of all that LiDAR has to offer.

Surfer's LiDAR Point Cloud Features
  • Create a point cloud from multiple LAS/LAZ files
  • Assign color by elevation, intensity, return number, or classification
  • Select points interactively or by criteria
  • Remove, reclassify or crop to selected points
  • Create a grid from the point cloud or export to LAS/LAZ
  • Visualize all aspects of the data in the 3D view
Surfer's LAS/LAZ Filtering Options
  • Spatial filtering based on XY bounds or elevation data limits
  • Import every Nth point
  • Import only the desired Return type or Classification values
  • Import data with specified Source ID
  • Flag filters such as scan direction, edge of flight, or synthetic, key, and withheld points

Streamlined Workflows

You will be up and running in matter of minutes. Surfer’s user interface was designed to take the guesswork out of learning a new program. We worked hard to streamline workflows so you don’t have to.

Surfer User Interface Features
  • Welcome dialog to get you started
  • Map wizard to quickly create maps and models
  • Customize ribbon and quick access toolbar
  • Dock or float all windows
  • Single window to view, edit, and manipulate the data and maps
  • Contents window to easily manage layers of maps and models
  • Properties window for quick feature editing
  • Worksheet window to view or edit raw data
Example blog post alt

Example blog post alt

Enhance Maps & Models

Surfer gives you the tools to visualize and model all types of data, but it doesn’t stop there. Surfer’s extensive customization options allow you to convey complex ideas in an easy to understand manner. Enhance your maps and models with a variety of customizations options.

Surfer Customization Options
  • Add legends, cross sections, magnifiers, scale bars, and multiple axes
  • Include headers and footers
  • Apply linear or logarithmic color scales
  • Adjust tilt, rotation, and field of view angle
  • Edit all axis parameters
  • Include graticule lines or another grid
  • Combine or stack multiple maps
  • Define custom line styles and colors
  • Edit text, line, fill and symbol properties
  • Add text, polylines, polygons, symbols, and spline polylines
  • Include range rings
  • Many more…

Full Grid Control

Surfer gives you extensive control over grid files. Create isopach maps for structural geology, calculate volumes for inventory management or derivatives for terrain analysis, and even create site suitability models all with grid files. Achieve a complete understanding of your underlying data.

Surfer Grid Features
  • Directly edit the underlying grid data
  • Calculate volume and area of grids
  • Add, subtract, multiply, and divide grids
  • Perform custom mathematical functions on grids
  • Calculate differential and integral operations or Fourier and spectral analysis
  • Convert areas to nodata
  • Project grids from one coordinate system to another
  • Mosaic multiple grids together seamlessly
  • Transform, offset, rescale, rotate, or mirror grids
  • Filter grids with high- and low-pass filters
  • Extract smaller areas from a grid
  • Subtract the Z in the grid from the original Z
Example blog post alt

Example blog post alt

Edit Contours

Edit contour lines down to the finest detail. Surfer’s grid editor lets you quickly adjust contour lines by interactively editing the underlying grid file. Brush, warp, smooth, push down or up, and erase grid nodes, and immediately see the changes to your grid-based maps.

  • Perform free-hand contour editing
  • Brush specific Z values across nodes
  • Smooth contours
  • Pull up or push down contours in specific areas
  • Warp contour lines
  • Erase parts of the contour map
  • Find the Z value at any XY point location

Grid Data with Certainty

Have complete confidence in the accuracy of your model. Surfer provides numerous interpolation methods to grid regularly or irregularly spaced data onto a grid or raster, and each interpolation method provides complete control over gridding parameters. Plus, no time is wasted with multithreaded gridding!

Surfer Gridding Methods
  • Kriging, Inverse Distance, Minimum Curvature
  • Natural Neighbor, Triangulation with Linear Interpolation, Nearest Neighbor
  • Local Polynomial, Polynomial Regression, Data Metrics
  • Radial Basis Function, Modified Shepard's Method, Moving Average
Surfer Interpolation Features
  • Variogram models
  • Anisotropy
  • Faults and breaklines
  • Control over search neighborhood size, shape, and constraints
  • Data filtering
  • Automatic data statistics
  • Create grid files directly from contour polylines
  • Grid to convex hull
  • Duplicate handling
  • Cross validation
  • Control over output geometry and resolution
  • Limit or clamp z-values
Example blog post alt

Example blog post alt

Make Meaningful Decisions

Get answers to your questions with Surfer’s geoprocessing tools. Process your data and analyze relationships. Narrow down areas of interest, highlight important intersections, or perform mathematical calculations on the underlying data to make informed decisions.

Surfer Geoprocessing Tools
  • View, create, edit and delete object attributes using the convenient Attribute Table
  • Perform Delaunay triangulation
  • Reshape, simplify, smooth polylines, polygons, and grids
  • Create buffers around points, polylines, and polygons
  • Convert between polygons and polylines
  • Create polygons by combining existing polygons
  • Create points or polygons in intersecting areas
  • Connect or break polylines at specified locations
  • Combine and split islands
  • Georeference images
Surfer Symbology
  • Apply line, fill, and symbol properties based on attribute values
  • Display symbology in the legend
  • Select symbology based on unique values, unclassed colors and symbols, and classed colors and symbols

Immediate Access to Online Data

An abundance of data is at your fingertips waiting to be visualized. Surfer gives you immediate access to worldwide aerial imagery, Open Street Map imagery, worldwide vector data, and terrain data. If you have your own favorite data servers or access to a private data server, include a custom link to that source for easy access. Surfer makes it easy to access the surplus of online data.

Supported server types:
  • Web mapping server (WMS)
  • Open Street Map server (OSM)
  • Web coverage server (WCS)
  • Web feature server (WFS)
Example blog post alt

Example blog post alt

Work Seamlessly with all Coordinate Systems

Your job is to transform data into valuable visualizations. Surfer’s job is to make it easy for you. Surfer effortlessly manages unreferenced data and data projected in different/multiple coordinate systems. It really is that easy.

Surfer Coordinate System Features
  • Over 2500 predefined coordinate systems
  • Create custom coordinate systems
  • Search coordinate systems by name or EPSG number
  • Reproject coordinate systems
  • Over 80 ellipsoids
  • Over 45 predefined linear units
  • Create custom linear units
  • Add graticule or grid lines to view different coordinate systems on a map

Complete Compatibility

Seamlessly visualize and analyze data from multiple sources. Surfer natively reads numerous file formats including SHP, DXF, and XLSX. Surfer also supports all popular export formats. An extensive set of data management tools are at your disposal for complete compatibility.

Example blog post alt

Example blog post alt

Collaborate with Confidence

Quickly share your work with colleagues, stakeholders, and clients. Surfer models are ready for printed publication with the high quality export formats including PDF or TIF. Alternatively, share your work online with web compatible formats like JPG or PNG. If you are preparing for a presentation, simply copy and paste your map or model into presentation tools such as Microsoft PowerPoint or Word.


Work Smart, Not Hard with Automation

Don’t waste time doing the same process over and over. Create scripts to automate repetitive or recurring tasks. Surfer can be called from any automation-compatible programming languages such as C , Python, or Perl. Surfer also ships with Scripter, a built-in Visual Basic compatible scripting tool.Save time with automation, and save even more time by reviewing the extensive set of sample scripts in the Surfer Automation Knowledge Base!

Example blog post alt